NETRESEC Network Security Blog - Tag : forensics

rss Google News

Carving Packets from Memory

The packets are in the router

Someone who says "We're gonna pull the packet captures out of the router" probably has no clue how to capture network traffic. In the Lindell case, statements like these were results of an elaborate hoax.

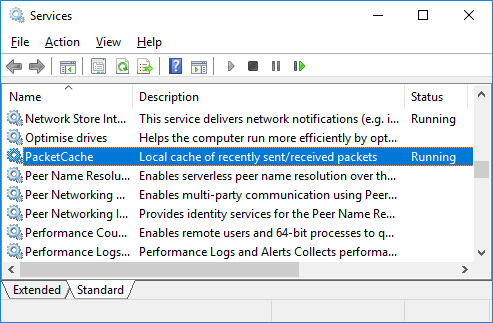
Nevertheless, such a statement doesn't have to be nonsense — if it comes from someone who knows how to dump the physical memory from the router. There are actually more packets available in the RAM of a router, or computer for that matter, than you might think.

The Forensic Challenge from DFRWS 2016 contains a memory dump from an SDN switch. If you drag-and-drop SDN.ram.raw from that challenge to CapLoader then you'll be asked if you wanna carve packets from the memory dump.

CapLoader error message - Invalid capture file

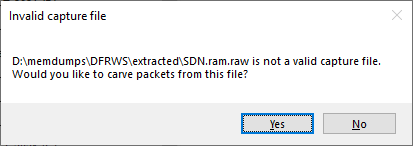
This packet carving feature is also available in the free trial version of CapLoader.

Clicking "Yes" in the dialogue brings up a configuration window. The default settings are okay in most cases.

CapLoader's Carve Packets Window

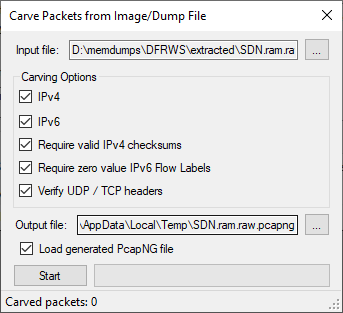
After pressing "Start" CapLoader will start identifying packets in the memory dump from the SDN switch. The packets will be saved to a Pcap-NG file located in the %TEMP% directory, unless you specified a different output location in the config window.

You can download a copy of the Pcap-NG file that I generated with CapLoader 1.9.2 here:
https://media.netresec.com/pcap/SDN.ram.raw.pcapng (661 kB, 2959 packets)

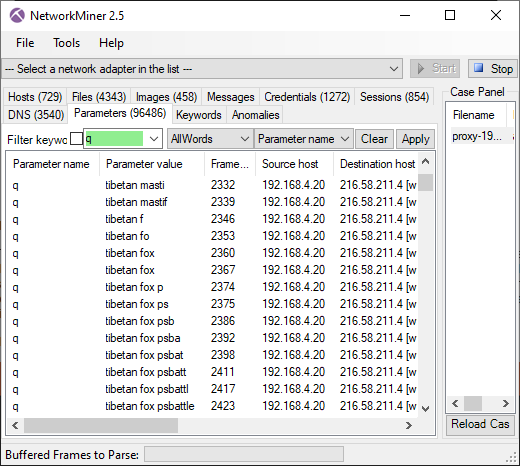
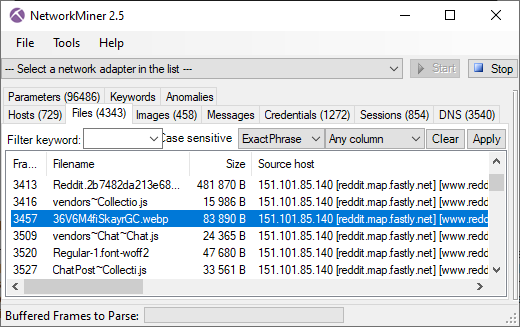
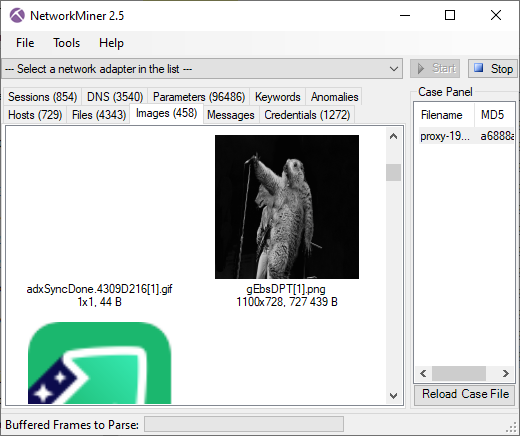
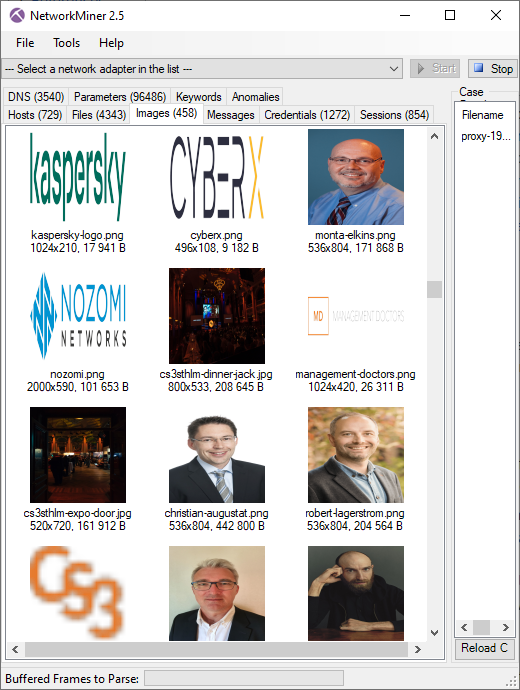
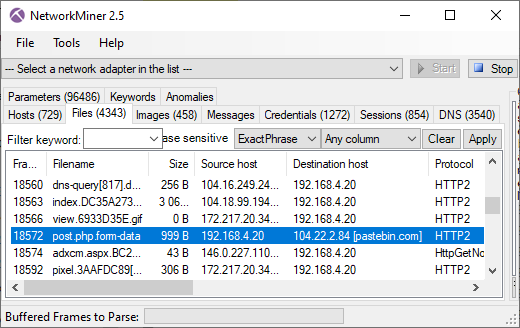
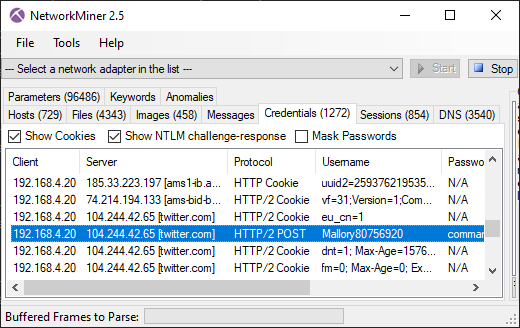
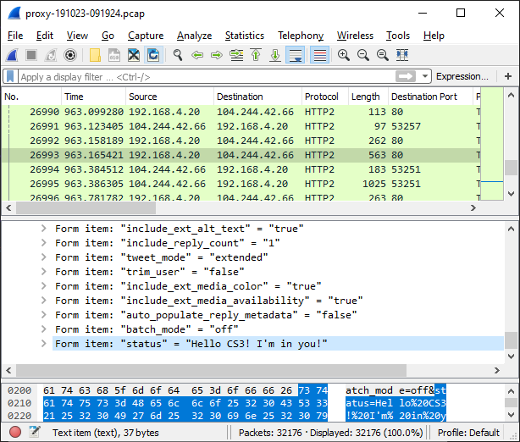
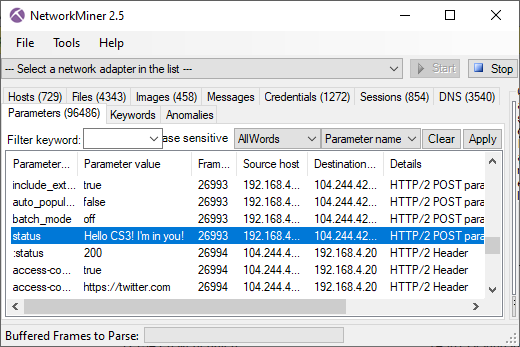
Here's what it looks like when the carved packets have been loaded into NetworkMiner Professional.

NetworkMiner Professional with SDN.ram.raw.pcapng loaded

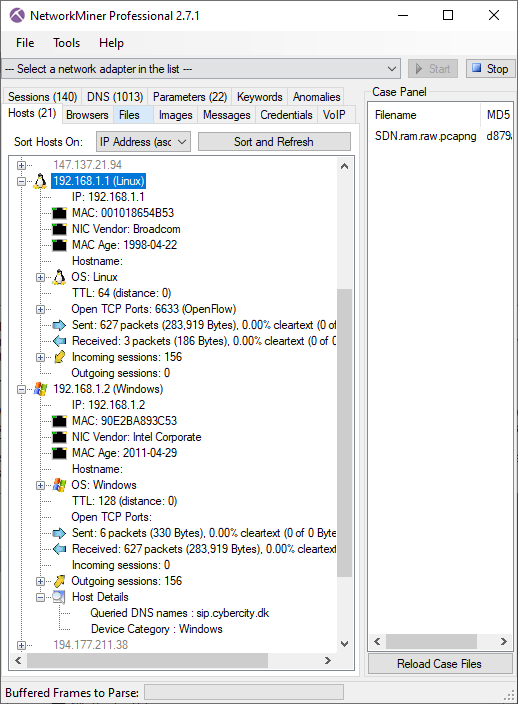
As you can see, a great deal of information can be extracted about the hosts on this network just by examining the dumped memory from the SDN switch.

What about Bulk Extractor?

Simson Garfinkel's bulk_extractor can also extract packets from memory dumps. It was actually a research paper by Simson that inspired me to implement a packet carver in the first place.

There are a few significant differences between bulk_extractor and CapLoader with regards to packet carving though. One difference is that bulk_extractor identifies network packets by looking for Ethernet frames containing IPv4 packets, while CapLoader looks for IPv4 or IPv6 packets containing TCP or UDP packets. The output from bulk_extractor is usually quite similar to that of CapLoader, and so is the parsing speed. CapLoader was just slightly faster in our tests and carved about 3% more packets compared to bulk_extractor, these additional packets were primarily IPv6 packets and packets that weren't encapsulated by an Ethernet frame.

Where can I download memory dumps?

I posted a question on Twitter, asking the #DFIR community for their favorite publicly available memory dumps prior to writing this blog post, and I received lots of great answers. Thank you all for contributing! I have now compiled the following list of places from where you can download memory dumps:

For a more detailed blog post on CapLoader's packet carving functionality, please see our Carving Network Packets from Memory Dump Files blog post from 2014.

Posted by Erik Hjelmvik on Tuesday, 31 August 2021 15:10:00 (UTC/GMT)

Tags: #Forensics#PCAP#Pcap-NG#PcapNG#DFIR#carve#dump#CapLoader#DFRWS

Share: Facebook   Twitter   Reddit   Hacker News Short URL: https://netresec.com/?b=218cf94


Discovered Artifacts in Decrypted HTTPS

We released a PCAP file earlier this year, which was recorded as part of a live TLS decryption demo at the CS3Sthlm conference. The demo setup used PolarProxy running on a Raspberry Pi in order to decrypt all HTTPS traffic and save it in a PCAP file as unencrypted HTTP.

Laptop, Raspberry Pi, PolarProxy, Internet ASCII

This capture file was later used as a challenge for our twitter followers, when we made the following announcement:

PCAP CHALLENGE!
The capture file released in this blog post contains a few interesting things that were captured unintentionally. Can you find anything strange, funny or unexpected in the pcap file? (1/2)

Followed by this message:

The person to submit the most interesting answer wins a “PCAP or it didn’t happen” t-shirt. Compete by including your discovery in a retweet or reply to this tweet, or in an email to info(at)netresec.com. We want your answers before the end of January. (2/2)

We'd like to thank everyone who submitted answers in this challenge, such as David Ledbetter, Christoffer Strömblad, RunΞ and Chris Sistrunk.

We're happy to announce that the winner of our challenge is David Ledbetter. Congratulations David!

So what were the interesting thing that could be found in the released capture file? Below is a short summary of some things that can be found.

Telemetry data sent to mozilla.org

A surprising amount of information about the Firefox browser was sent to incoming.telemetry.mozilla.org, including things like:

  • Active browser addons
  • Active browser plugins
  • Firefox profile creation date
  • Browser search region
  • Default search engine
  • Regional locales
  • Screen width
  • Screen height
  • CPU vendor, family and model
  • HDD model, revision and type
  • Installed RAM
  • Operating system
  • Etc..

Here's an excerpt showing a part of the data sent to Mozilla:

"build": { "applicationId": "{ec8030f7-c20a-464f-9b0e-13a3a9e97384}", "applicationName": "Firefox", "architecture": "x86-64", "buildId": "20191002194346", "version": "69.0.2", "vendor": "Mozilla", "displayVersion": "69.0.2", "platformVersion": "69.0.2", "xpcomAbi": "x86_64-gcc3", "updaterAvailable": false }, "partner": { "distributionId": "canonical", "distributionVersion": "1.0", "partnerId": "ubuntu", "distributor": "canonical", "distributorChannel": "ubuntu", "partnerNames": [ "ubuntu" ] }, "system": { "memoryMB": 3943, "virtualMaxMB": null, "cpu": { "count": 1, "cores": 1, "vendor": "GenuineIntel", "family": 6, "model": 42, "stepping": 7, "l2cacheKB": 256, "l3cacheKB": 4096, "speedMHz": null, "extensions": [ "hasMMX", "hasSSE", "hasSSE2", "hasSSE3", "hasSSSE3", "hasSSE4_1", "hasSSE4_2", "hasAVX", "hasAES" ] }, "os": { "name": "Linux", "version": "5.0.0-31-generic", "locale": "en-US" }, "hdd": { "profile": { "model": null, "revision": null, "type": null }, "binary": { "model": null, "revision": null, "type": null }, "system": { "model": null, "revision": null, "type": null } }, "gfx": { "D2DEnabled": null, "DWriteEnabled": null, "ContentBackend": "Skia", "Headless": false, "adapters": [ { "description": "llvmpipe (LLVM 8.0, 256 bits)", "vendorID": "0xffff", "deviceID": "0xffff", "subsysID": null, "RAM": 3942, "driver": null, "driverVendor": "mesa/llvmpipe", "driverVersion": "19.0.8.0", "driverDate": null, "GPUActive": true } ], "monitors": [ { "screenWidth": 681, "screenHeight": 654 } ], "features": { "compositor": "basic", "gpuProcess": { "status": "unavailable" }, "wrQualified": { "status": "blocked-vendor-unsupported" }, "webrender": { "status": "opt-in" } } }, "appleModelId": null }, "settings": { "blocklistEnabled": true, "e10sEnabled": true, "e10sMultiProcesses": 8, "telemetryEnabled": false, "locale": "en-US", "intl": { "requestedLocales": [ "en-US" ], "availableLocales": [ "en-US", "en-CA", "en-GB" ], "appLocales": [ "en-US", "en-CA", "en-GB", "und" ], "systemLocales": [ "en-US" ], "regionalPrefsLocales": [ "sv-SE" ], "acceptLanguages": [ "en-US", "en" ] }, "update": { "channel": "release", "enabled": true, "autoDownload": false }, "userPrefs": { "browser.cache.disk.capacity": 1048576, "browser.search.region": "SE", "browser.search.widget.inNavBar": false, "network.trr.mode": 2 }, "sandbox": { "effectiveContentProcessLevel": 4 }, "addonCompatibilityCheckEnabled": true, "isDefaultBrowser": false, "defaultSearchEngine": "google", "defaultSearchEngineData": { "name": "Google", "loadPath": "[distribution]/searchplugins/locale/en-US/google.xml", "origin": "default", "submissionURL": "https://www.google.com/search?client=ubuntu&channel=fs&q=&ie=utf-8&oe=utf-8" } }, "profile": { "creationDate": 18183, "firstUseDate": 18183 }

You can use the following Wireshark display filter to find all the data sent to Mozilla:

http.request.method eq POST and http.host contains telemetry

Public IP Revealed in PCAP

The client's IP address was 192.168.4.20, which is part of the RFC 1918 192.168/16 private address space. It's therefore safe to assume that the client was behind a NAT (the client was in fact behind a double NAT). However, we noticed that the public IP of the client was revealed through multiple services in the captured network traffic. One of these services is the advertising exchange company AppNexus (adnxs.com), which sent the client's public IP address 193.235.19.252 in an X-Proxy-Origin HTTP header.

X-Proxy-Origin HTTP header in Wireshark

You can use the following Wireshark/tshark display filter to find X-Proxy-Origin headers:

http.response.line matches "x-proxy-origin" or http2.header.name matches "x-proxy-origin"

We are using the "matches" operator here instead of "contains" or "==" because we want to perform case insensitive matching. You might also notice that we need a completely different display filter syntax to match HTTP/2 headers compared to what we are used to with HTTP/1.1.

Monty Python "Majestik møøse" reference in reddit x-header

The reddit server 151.101.85.140 sends an HTTP/2 header called "x-moose" with a value of "majestic".

x-moose 1 : majestic header from reddit

This header refers to the opening credits of Monty Python and the Holy Grail.

Wi nøt trei a høliday in Sweden this yër?

Posted by Erik Hjelmvik on Tuesday, 17 March 2020 09:00:00 (UTC/GMT)

Tags: #HTTP/2#http2#TLS#decrypt#TLSI#PolarProxy#NetworkMiner#Wireshark#CS3Sthlm#CS3#Forensics#PCAP#ASCII-art

Share: Facebook   Twitter   Reddit   Hacker News Short URL: https://netresec.com/?b=2030e17


Sharing a PCAP with Decrypted HTTPS

Modern malware and botnet C2 protocols use TLS encryption in order to blend in with "normal" web traffic, sometimes even using legitimate services like Twitter or Instagram.

I did a live demo at the CS3Sthlm conference last year, titled "TLS Interception and Decryption", where I showed how TLS interception can be used to decrypt and analyze malicious HTTPS network traffic. During the demo I used DNS-over-HTTPS (DoH) and posted messages to Pastebin and Twitter, pretending to be a malware or malicious actor. The HTTPS network traffic was decrypted and analyzed live as part of my demo. The CS3Sthlm organizers have posted a video recording of the live demo on YouTube.

Erik presenting PolarProxy at CS3Sthlm, photo credit: CS3Sthlm

Image: Erik demoing TLS Interception and Decryption at CS3Sthlm 2019

We are now releasing a PCAP file with the decrypted network traffic captured during this live demo here:

» https://media.netresec.com/pcap/proxy-191023-091924.pcap «

This blog post provides a step-by-step walk-through of the decrypted HTTPS traffic in the released capture file.

The TLS decryption was performed by connecting a laptop to a custom WiFi access point, which was a Raspberry Pi configured as in our "Raspberry Pi WiFi Access Point with TLS Inspection" blog post. I additionally enabled the PCAP-over-IP feature in PolarProxy by starting it with the "--pcapoverip 57012" option. This allowed me to connect with Wireshark and NetworkMiner to TCP port 57012 on the TLS proxy and stream the decrypted traffic in order to perform live network traffic analysis.

Laptop, Raspberry Pi, PolarProxy, Internet ASCII

Image: Live demo network with Laptop (Browser, NetworkMiner, Wireshark), Raspberry Pi (PolarProxy) and the Internet.

Below follows a breakdown of various significant events of my demo and where you can find these events in the released capture file.

DNS lookup of "www.google.com" using DoH

  • Frame: 833
  • Protocol: DoH using HTTP/2 POST
  • Five tuple: 192.168.4.20:52694 104.16.248.249:80 TCP
DoH lookup of www.google.com shown in NetworkMiner DoH lookup of www.google.com shown in Wireshark

Google search for "tibetan fox psbattle"

  • Frame: 2292
  • Protocol: HTTP/2
  • Five tuple: 192.168.4.20:52716 216.58.211.4:80 TCP
Google search for 'tibetan fox psbattle' in Wireshark Google search for 'tibetan fox psbattle' in NetworkMiner

Tibetan Fox image downloaded from reddit

  • Frame: 3457
  • Protocol: HTTP/2
  • Five tuple: 192.168.4.20:52728 151.101.85.140:80 TCP
Image download from reddit shown in NetworkMiner

Orginal "tibetan fox" image downloaded from this reddit thread.

Tibetan Fox Remix Image HTTP/2 Download

  • Frame: 5805
  • Protocol: HTTP/2
  • Five tuple: 192.168.4.20:52769 151.101.84.193:80 TCP
Images downloaded via HTTP/2

DNS Lookup of "cs3sthlm.se"

  • Frame: 13494
  • Protocol: DoH using HTTP/2 POST
  • Five tuple: 192.168.4.20:52699 104.16.249.249:80 TCP

Images downloaded from CS3Sthlm's website

  • Frame: 14134
  • Protocol: HTTP/1.1
  • Five tuple: 192.168.4.20:52896 192.195.142.160:80 TCP
Images downloaded from CS3Sthlm's website

Data sent in HTTP/2 POST to Pastebin

  • Frame: 18572
  • Protocol: HTTP/2 POST
  • Five tuple: 192.168.4.20:52904 104.22.2.84:80 TCP
Data sent to Pastebin in HTTP/2 POST

The file "post.php.form-data" contains the data sent to Pastebin in the HTTP/2 POST request. Here are the reassembled contents of that file, including the "hello cs3 I am a malware" message:

-----------------------------54168074520069581482009826076
Content-Disposition: form-data; name="csrf_token_post"

MTU3MTgyMjg5OTFwcjBzODJaQ0NuUk9PT1B3ZTl0b20zdFg3ZkhXQ1R4
-----------------------------54168074520069581482009826076
Content-Disposition: form-data; name="submit_hidden"

submit_hidden
-----------------------------54168074520069581482009826076
Content-Disposition: form-data; name="paste_code"

hello cs3 I am a malware
-----------------------------54168074520069581482009826076
Content-Disposition: form-data; name="paste_format"

1
-----------------------------54168074520069581482009826076
Content-Disposition: form-data; name="paste_expire_date"

1H
-----------------------------54168074520069581482009826076
Content-Disposition: form-data; name="paste_private"

0
-----------------------------54168074520069581482009826076
Content-Disposition: form-data; name="paste_name"

malware traffic
-----------------------------54168074520069581482009826076--

Mallory80756920 logs in to Twitter

  • Frame: 24881
  • Protocol: HTTP/2 POST
  • Five tuple: 192.168.4.20:53210 104.244.42.65:80 TCP
Twitter credentials for Mallory80756920

Mallory80756920 posts a Tweet

  • Frame: 26993
  • Protocol: HTTP/2 POST
  • Five tuple: 192.168.4.20:53251 104.244.42.66:80 TCP

Mallory80756920 tweeted "Hello CS3! I'm in you!". The data was sent to twitter using an HTTP/2 POST request.

Twitter post in Wireshark Twitter post in NetworkMiner

Conclusions

A great deal of the interesting TLS traffic in the analyzed capture file is using the HTTP/2 protocol. This doesn't come as a surprise since more than half of all HTTPS traffic is using HTTP/2 nowadays (sources: server protocol statistics, client protocol statistics). It is therefore essential to be able to analyze HTTP/2 traffic if you have a TLS inspection (TLSI) solution in place. Unfortunately many TLSI products don't yet support the HTTP/2 protocol.

Wireshark was one of the first network traffic analysis tools to implement HTTP/2 support, much thanks to Alexis La Goutte. However, Wireshark's excellent "File > Export Objects" doesn't yet support extraction of files from HTTP/2 traffic. There are other ways to extract HTTP/2 file transfers with Wireshark, but they require a few additional steps in order to carve out the file to disk.

Luckily NetworkMiner extracts files from HTTP/2 as of version 2.5. In fact, we believe NetworkMiner is the first open source tool to support automatic HTTP/2 file extraction from PCAP.

Finally, I'd like to stress the point that modern malware use HTTPS, so you need to have a TLSI solution in place to analyze the malicious traffic. As the majority of all HTTPS traffic is using HTTP/2 you also need to ensure that you're able to analyze HTTP/2 traffic passing through your TLSI solution.

Posted by Erik Hjelmvik on Monday, 13 January 2020 12:45:00 (UTC/GMT)

Tags: #HTTP/2#http2#DoH#TLS#Google#decrypt#HTTPS#TLSI#TLS Inspection#TLS Interception#PolarProxy#NetworkMiner#Wireshark#CS3Sthlm#CS3#Forensics#PCAP#Video

Share: Facebook   Twitter   Reddit   Hacker News Short URL: https://netresec.com/?b=2015d89


Zyklon Malware Network Forensics Video Tutorial

We are releasing a series of network forensics video tutorials throughout the next few weeks. First up is this analysis of a PCAP file containing network traffic from the "Zyklon H.T.T.P." malware.

Analyzing a Zyklon Trojan with Suricata and NetworkMiner

Resources
https://www.malware-traffic-analysis.net/2017/07/22/index.html
https://github.com/Security-Onion-Solutions/security-onion
https://www.arbornetworks.com/blog/asert/wp-content/uploads/2017/05/zyklon_season.pdf
http://doc.emergingthreats.net/2017930

IOCs
service.tellepizza.com
104.18.40.172
104.18.41.172
Mozilla/5.0 (Windows; U; Windows NT 5.1; en-US; rv:1.8.1.3pre) Gecko/20070302 BonEcho/2.0.0.3pre
gate.php
.onion
98:1F:D2:FF:DC:16:B2:30:1F:11:70:82:3D:2E:A5:DC
65:8A:5C:76:98:A9:1D:66:B4:CB:9D:43:5C:DE:AD:22:38:37:F3:9C
E2:50:35:81:9F:D5:30:E1:CE:09:5D:9F:64:75:15:0F:91:16:12:02:2F:AF:DE:08:4A:A3:5F:E6:5B:88:37:D6

Posted by Erik Hjelmvik on Monday, 05 February 2018 07:30:00 (UTC/GMT)

Tags: #Netresec#PCAP#Trojan#video#tutorial#videotutorial#NetworkMiner#SecurityOnion#Suricata#malware#network#forensics#NSM#malware_traffic

Share: Facebook   Twitter   Reddit   Hacker News Short URL: https://netresec.com/?b=182b4ac


NetworkMiner 2.2 Released

NetworkMiner 2.2 = Harder Better Faster Stronger

NetworkMiner 2.2 is faster, better and stronger than ever before! The PCAP parsing speed has more than doubled and even more details are now extracted from analyzed packet capture files.

The improved parsing speed of NetworkMiner 2.2 can be enjoyed regardless if NetworkMiner is run in Windows or Linux, additionally the user interface is more responsive and flickers way less when capture files are being loaded.

User Interface Improvements

The keyword filter available in the Files, Messages, Sessions, DNS and Parameters tabs has been improved so that the rows now can be filtered on a single column of choice by selecting the desired column in a drop-down list. There is also an “Any column” option, which can be used to search for the keyword in all columns.

Keyword drop-down in NetworkMiner's Parameters tab

The Messages tab has also received an additional feature, which allows the filter keyword to be matched against the text in the message body as well as email headers when the “Any column” option is selected. This allows for an efficient analysis of messages (such as emails sent/received through SMTP, POP3 and IMAP as well as IRC messages and some HTTP based messaging platforms), since the messages can be filtered just like in a normal e-mail client.

We have also given up on using local timestamp formats; timestamps are now instead shown using the yyyy-MM-dd HH:mm:ss format with time zone explicitly stated.

Protocol Parsers

NetworkMiner 2.2 comes with a parser for the Remote Desktop Protocol (RDP), which rides on top of COTP and TPKT. The RDP parser is primarily used in order to extract usernames from RDP cookies and show them on the Credentials tab. This new version also comes with better extraction of SMB1 and SMB2 details, such as NTLM SSP usernames.

RDP Cookies extracted with NetworkMiner 2.2

One big change that has been made behind the scenes of NetworkMiner is the move from .NET Framework 2.0 to version 4.0. This move doesn’t require any special measures to be taken for most Microsoft Windows users since the 4.0 Framework is typically already installed on these machines. If you’re running NetworkMiner in Linux, however, you might wanna check out our updated blog post on how to install NetworkMiner in Linux.

We have also added an automatic check for new versions of NetworkMiner, which runs every time the tool is started. This update check can be disabled by adding a --noupdatecheck switch to the command line when starting NetworkMiner.

NetworkMiner.exe --noupdatecheck capturefile.pcap

NetworkMiner Professional

Even though NetworkMiner 2.2 now uses ISO-like time representations NetworkMiner still has to decide which time zone to use for the timestamps. The default decision has always been to use the same time zone as the local machine, but NetworkMiner Professional now additionally comes with an option that allows the user to select whether to use UTC (as nature intended), the local time zone or some other custom time zone for displaying timestamps. The time zone setting can be found in the “Tools > Settings” menu.

UPDATE: With the release of NetworkMiner 2.3 the default time zone is now UTC unless the user has specifically selected a different time zone.

The Port-Independent-Protocol-Detection (PIPI) feature in NetworkMiner Pro has been improved for more reliable identification of HTTP, SSH, SOCKS, FTP and SSL sessions running on non-standard port numbers.

CASE / JSON-LD Export

We are happy to announce that the professional edition of NetworkMiner 2.2 now has support for exporting extracted details using the Cyber-investigation Analysis Standard Expression (CASE) format, which is a JSON-LD format for digital forensics data. The CASE export is also available in the command line tool NetworkMinerCLI.

We would like to thank Europol for recommending us to implement the CASE export format in their effort to adopt CASE as a standard digital forensic format. Several other companies in the digital forensics field are currently looking into implementing CASE in their tools, including AccessData, Cellebrite, Guidance, Volatility and XRY. We believe the CASE format will become a popular format for exchanging digital forensic data between tools for digital forensics, log correlation and SIEM solutions.

We will, however, still continue supporting and maintaining the CSV and XML export formats in NetworkMiner Professional and NetworkMinerCLI alongside the new CASE format.

Credits

I would like to thank Sebastian Gebhard and Clinton Page for reporting bugs in the Credentials tab and TFTP parsing code that now have been fixed. I would also like to thank Jeff Carrell for providing a capture file that has been used to debug an issue in NetworkMiner’s OpenFlow parser. There are also a couple of users who have suggested new features that have made it into this release of NetworkMiner. Marc Lindike suggested the powerful deep search of extracted messages and Niclas Hirschfeld proposed a new option in the PCAP-over-IP functionality that allows NetworkMiner to receive PCAP data via a remote netcat listener.

Upgrading to Version 2.2

Users who have purchased a license for NetworkMiner Professional 2.x can download a free update to version 2.2 from our customer portal.

Those who instead prefer to use the free and open source version can grab the latest version of NetworkMiner from the official NetworkMiner page.

Posted by Erik Hjelmvik on Tuesday, 22 August 2017 11:37:00 (UTC/GMT)

Tags: #pcap#CASE#PIPI#HTTP#SOCKS#FTP#SSL#port#forensics

Share: Facebook   Twitter   Reddit   Hacker News Short URL: https://netresec.com/?b=17888cb


PacketCache lets you Go Back in Time

PacketCache logo

Have you ever wanted to go back in time to get a PCAP of something strange that just happened on a PC?
I sure have, many times, which is why we are now releasing a new tool called PacketCache. PacketCache maintains a hive of the most important and recent packets, so that they can be retrieved later on, if there is a need.

Network forensics and incident response is performed post-event, but requires that packet have already been captured during the event to be analyzed. Starting a network sniffer after a suspected intrusion might provide useful insight on what the intruders are up to, but it is much better to be able to go back in time to observe how they gained access to the network and what they did prior to being detected. Many companies and organizations combat this problem by setting up one or several solutions for centralized network packet capturing. These sniffers are typically installed at choke-points on the network, such as in-line with a firewall. However, this prevents the sniffers from capturing network traffic going between hosts on the same local network. Intruders can therefore often perform lateral movement on a compromised network without risk getting their steps captured by a packet sniffer.

Logo for Back to the Future series logo - public domain

USB broadband modem, credit: Game Gavel (cc-by-sa-3.0)
Image by Game Gavel
We're now trying to improve the situation for the defenders by releasing PacketCache, which is a free (Creative Commons licensed) Windows service that is designed to continuously monitor the network interfaces of a computer and store the captured packets in memory (RAM). PacketCache monitors all IPv4 interfaces, not just the one connected to the corporate network. This way traffic will be captured even on public WiFi networks and Internet connections provided through USB broadband modems (3G/4G).

By default PacketCache reserves 1% of a computer's total physical memory for storing packets. A computer with 4 GB of RAM will thereby allow up to 40 MB of packets to be kept in memory. This might not seem like much, but PacketCache relies on a clever technique that allows it to store only the most important packets. With this technique just 40 MB of storage can be enough to store several days worth of “important” packets.

The “clever technique” we refer to is actually a simple way of removing packets from TCP and UDP sessions as they get older. This way recent communication can be retained in full, while older data us truncated at the end (i.e. only the last packets are removed from a session).

PacketCache services in services.msc

To download PacketCache or learn more about this new tool, please visit the official PacketCache page:
https://www.netresec.com/?page=PacketCache

PCAP or it didn't happen!

Posted by Erik Hjelmvik on Wednesday, 28 September 2016 11:45:00 (UTC/GMT)

Tags: #PacketCache#PCAP#NSM#forensics#Windows#sniffer#DFIR

Share: Facebook   Twitter   Reddit   Hacker News Short URL: https://netresec.com/?b=169d0d2


PCAP or it didn't happen

The phrase "PCAP or it didn't happen" is often used in the network security field when someone want proof that an attack or compromise has taken place. One such example is the recent OpenSSL heartbleed vulnerability, where some claim that the vulnerability was known and exploited even before it was discovered by Google's Neel Mehta and Codenomicon.

PCAP or it didn't happen pwnie, original by Nina on http://n924.deviantart.com
Image: PCAP or it didn't happen pwnie, original by Nina

After the Heartbleed security advisory was published, EFF tweeted:

"Anyone reproduced observations of #Heartbleed attacks from 2013?"
and Liam Randall (of Bro fame) tweeted:
"If someone finds historical exploits of #Heartbleed I hope they can report it. Lot's of sites mining now."

Liam Randall (@Hectaman) tweeting about historical Heartbleed searches Heartbleed

It is unfortunately not possible to identify Heartbleed attacks by analyzing log files, as stated by the following Q&A from the heartbleed.com website:

Can I detect if someone has exploited this against me?

Exploitation of this bug does not leave any trace of anything abnormal happening to the logs.

Additionally, IDS  signatures  for detecting the Heartbleed attacks weren't available until after implementations of the exploit code were being actively used in the wild.

Hence, the only reliable way of detecting early heartbleed attacks (i.e. prior to April 7) is to analyze old captured network traffic from before April 7. In order to do this you should have had a full packet capture running, which was configured to capture and store all your traffic. Unfortunately many companies and organizations haven't yet realized the value that historical packet captures can provide.

Why Full Packet Capture Matters

Some argue that just storing netflow data is enough in order to do incident response. However, detecting events like the heartbleed attack is impossible to do with netflow since you need to verify the contents of the network traffic.

Not only is retaining historical full packet captures useful in order to detect attacks that have taken place in the past, it is also extremely valuable to have in order to do any of the following:

  • IDS Verification
    Investigate IDS alerts to see if they were false positives or real attacks.

  • Post Exploitation Analysis
    Analyze network traffic from a compromise to see what the attacker did after hacking into a system.

  • Exfiltration Analysis
    Assess what intellectual property that has been exfiltrated by an external attacker or insider.

  • Network Forensics
    Perform forensic analysis of a suspect's network traffic by extracting files, emails, chat messages, images etc.

Setting up a Full Packet Capture

netsniff-ng logo

The first step, when deploying a full packet capture (FPC) solution, is to install a network tap or configure a monitor port in order to get a copy of all packets going in and out from your networks. Then simply sniff the network traffic with a tool like dumpcap or netsniff-ng. Another alternative is to deploy a whole network security monitoring (NSM) infrastructure, preferably by installing the SecurityOnion Linux distro.

A network sniffer will eventually run out of disk, unless captured network traffic is written to disk in a rung buffer manner (use "-b files" switch in dumpcap) or there is a scheduled job in place to remove the oldest capture files. SecurityOnion, for example, normally runs its "cleandisk" cronjob when disk utilization reaches 90%.

The ratio between disk space and utilized bandwidth becomes the maximum retention period for full packet data. We recommend having a full packet capture retention period of at least 7 days, but many companies and organizations are able to store several month's worth of network traffic (disk is cheap).

Big Data PCAP Analysis

Okay, you've got a PCAP store with multiple terabytes of data. Then what? How do you go about analyzing such large volumes of captured full content network traffic? Well, tasks like indexing and analyzing PCAP data are complex matters than are beyond the scope of this blog post. We've covered the big data PCAP analysis topic in previous  blog posts, and there is more to come. However, capturing the packets to disk is a crucial first step in order to utilize the powers of network forensics. Or as the saying goes “PCAP or it didn't happen”.

Posted by Erik Hjelmvik on Thursday, 01 May 2014 21:45:00 (UTC/GMT)

Tags: #sniffer#IDS#forensics

Share: Facebook   Twitter   Reddit   Hacker News Short URL: https://netresec.com/?b=1452D4C

X / twitter

NETRESEC on X / Twitter: @netresec

Mastodon

NETRESEC on Mastodon: @netresec@infosec.exchange