FlowCarp Identifies Protocols

I am thrilled to announce the release of a brand new tool called FlowCarp!
FlowCarp is a simple command line tool that performs a very complicated task. It identifies the application layer protocol in network traffic without relying on port numbers, static signatures or code that tries to parse the application layer protocols. Instead, FlowCarp simply computes some statistical measurements on the traffic it sees and compares those measurements to models of known protocols. This allows FlowCarp to identify even proprietary and undocumented protocols, including malware C2 protocols.
FlowCarp Demo Service
There’s a demo FlowCarp web service running on demo.flowcarp.com, which accepts PCAP or PcapNG data via HTTP POST requests. The demo service returns a data structure, which follows the Suricata Eve JSON format, containing flows and alerts. I’d like to stress, however, that the returned flow and alert data is generated by FlowCarp and NOT by Suricata. The Suricata Eve JSON format supports pretty much everything we look for in a good flow and alert output format, which is why we decided to use their format instead of inventing yet another JSON based log format.
Let’s give the FlowCarp demo server a spin to see what it can do! I’ll start by downloading the PcapNG file from a suspected Mirai sample execution on Recorded Future’s Triage sandbox.
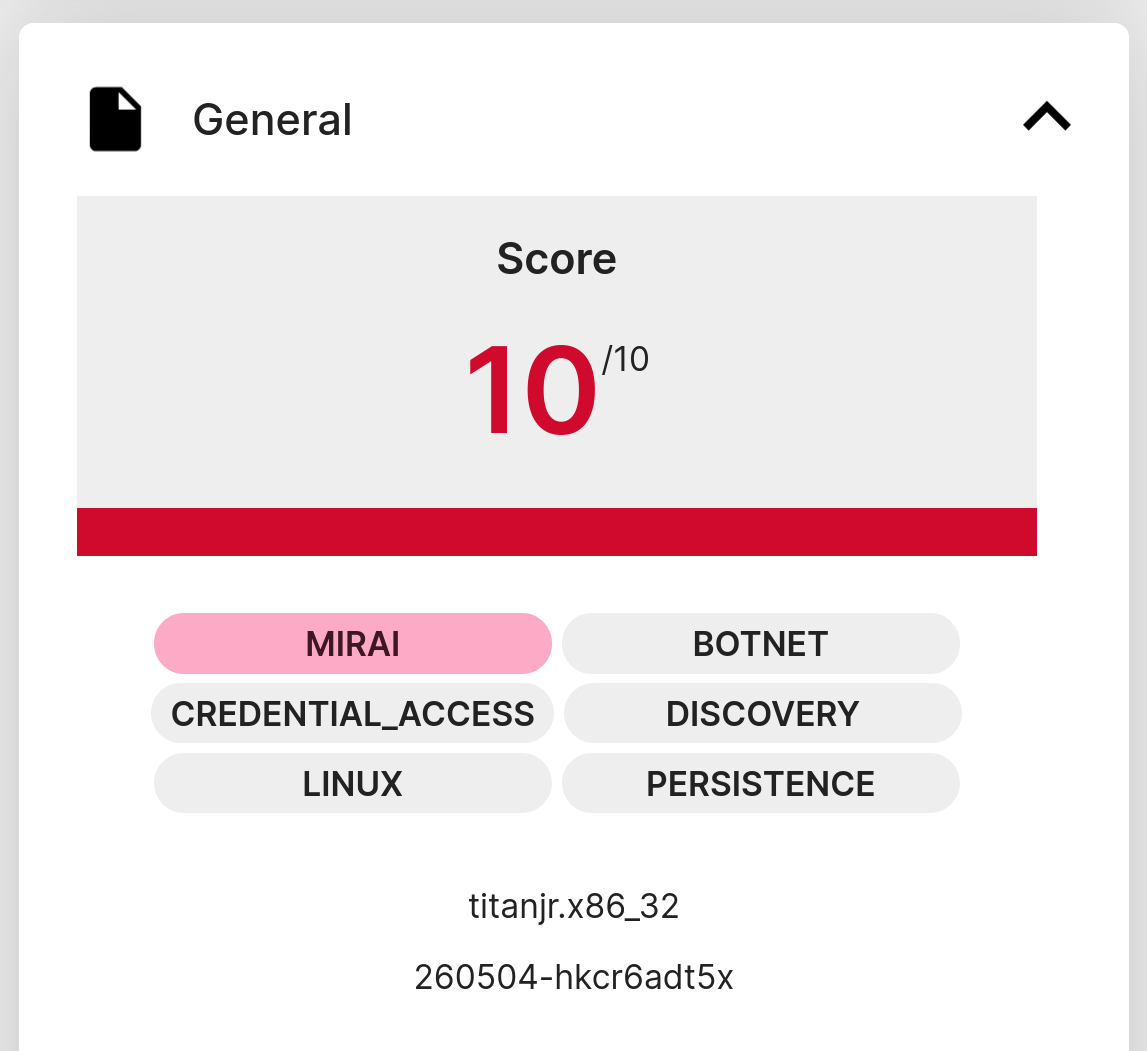
I’ve saved the capture file from Triage locally as “260504-hkcr6adt5x-behavioral1.pcapng”. This file can now be submitted to the FlowCarp demo service like this:
The generated mirai-eve.json file should now contain information about the flows and alerts that FlowCarp has found in the pcapng file. Let’s check which unique services that were contacted in the sandbox execution of this malware sample. I’m using jq to filter on event_type “flow” to show connection information instead of alerts.
- jq -c 'select(.event_type=="flow")|[.dest_ip, .dest_port, .proto, .app_proto]' < mirai-eve.json | sort -u
- ["107.189.17.70",80,"TCP","Mirai"]
- ["107.189.17.70",80,"TCP",null]
- ["1.1.1.1",53,"UDP","DNS"]
- ["185.125.188.61",443,"TCP","DNS"]
- ["185.125.188.62",443,"TCP","DNS"]
- ["224.0.0.251",5353,"UDP","DNS"]
- ["44.219.148.160",443,"TCP","TLS"]
- ["84.17.50.24",443,"TCP","DNS"]
- ["84.17.50.8",443,"TCP","TLS"]
- ["8.8.8.8",53,"UDP","BACnet"]
- ["8.8.8.8",53,"UDP","DNS"]
- ["8.8.8.8",53,"UDP","GTPv2"]
Alright, let’s see if any of those connections generated an alert:
- jq -r -c 'select(.event_type=="alert")|[.dest_ip, .dest_port, .proto, .alert.signature]' < mirai-eve.json | sort -u
- ["107.189.17.70",80,"TCP","MALWARE protocol detected: Mirai"]
FlowCarp tells us that the malware implant is using the Mirai C2 protocol to connect to a C2 server on TCP 107.189.17.70:80.
Running FlowCarp Locally
You can, of course, run FlowCarp locally on your own computer or in a container/pod instead of using the demo service. There are pre-compiled binaries of FlowCarp available for download on flowcarp.com for most platforms.
Let’s re-analyze the Mirai pcapng file, which was sent to the online demo service, but this time FlowCarp will run locally.
- ./flowcarp --input 260504-hkcr6adt5x-behavioral1.pcapng --output - 2>/dev/null | cut -d, -f 2,3,4 | sort -u
- 107.189.17.70:80, TCP
- 107.189.17.70:80, TCP, Mirai
- 1.1.1.1:53, UDP, DNS
- 185.125.188.61:443, TCP, DNS
- 185.125.188.62:443, TCP, DNS
- 224.0.0.251:5353, UDP, DNS
- 44.219.148.160:443, TCP, TLS
- 84.17.50.24:443, TCP, DNS
- 84.17.50.8:443, TCP, TLS
- 8.8.8.8:53, UDP, DNS
I let FlowCarp use its CSV output format instead of Eve JSON here, which is why cut was used to filter the output instead of jq. Nevertheless, the results are pretty much the same as before; FlowCarp detects Mirai traffic to 107.189.17.70:80.
You can try sending this same capture file to an IDS of your choice to see what alerts you get. Chances are that you might not get any alert for the Mirai traffic, since it is rather tricky to create good signatures for the Mirai C2 protocol. FlowCarp, on the other hand, doesn’t need any signatures to detect a protocol. All that is needed to build detection in FlowCarp is some example traffic of the protocol you’d like to identify. This unique feature is what makes FlowCarp so fantastic!
Real-Time Protocol Identification
FlowCarp is designed to run fast and use little resources, so that it can be used for local real-time analysis of network traffic. My general recommendation would be to run FlowCarp as a systemd service or to put it in a container or pod, but if you just want to test its real-time abilities then I suggest that you run this command:
FlowCarp will then read real-time PCAP data from standard input and print flow information – with identified application protocols – to standard output.
FlowCarp can also read real-time packet data through PCAP-over-IP, which allows us to utilize services like Fox-IT’s pcap-broker. You can start a pcap-broker listener like this:
FlowCarp can then access a real-time packet stream from the pcap-broker:
I hope you'll find FlowCarp useful!
Posted by Erik Hjelmvik on Monday, 04 May 2026 14:53:00 (UTC/GMT)
Tags: #FlowCarp #protocol identification #Triage #tcpdump