Showing blog posts from March 2011

rss Google News

Network Forensic Analysis of SSL MITM Attacks

Enigma-inspired rotor machine

The big news this past week has been the attack against Comodo where false certificates were created for popular domains like google.com, yahoo.com, live.com and skype.com.

Comodo is a Certificate Authority (CA) that your browser trusts, this means that these false certificates would be accepted by most browsers. But the attack was luckily discovered and the false certificates have now been revoked.

Someone performing a man-in-the-middle (MITM) attack on HTTPS traffic (i.e. HTTP over SSL) would be able to see all content of the encrypted communication, including transmitted usernames and passwords. Such MITM attacks can be performed by someone at your local WiFi connected coffee shop, your employer, your ISP or your government.

There are several ways users can detect MITM attacks, even when the certificate seems to be signed by a trusted CA. There are, for example, Firefox plugins available from Certificate Patrol as well as Perspectives that can help users by alerting on “new” certificates that have not been seen before.

But how would you go about doing forensic analysis of captured network traffic from a suspected MITM attack?

My suggestion is to load the pcap into NetworkMiner, which will automatically extract the X.509 certificates from the SSL streams to files with the “.cer” extension. These .cer files can be opened in MS Windows default certificate viewer for further inspection, simply right-click the extracted file in NetworkMiner and select “Open file”. I will in this blog post use the file “test1.pcap” from the “social nOtworking site” pcapr.net.

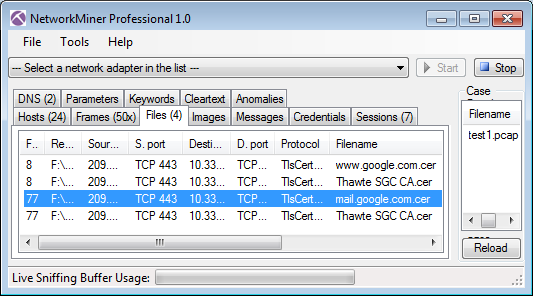
SSL capture file test1.pcap opened in NetworkMiner Professional

The first thing to inspect in a possible MITM attack is to verify that the IP and DNS name of the server seem to be correct. The next step is to look closer at the server's certificate, for example by opening the .cer file in Windows.

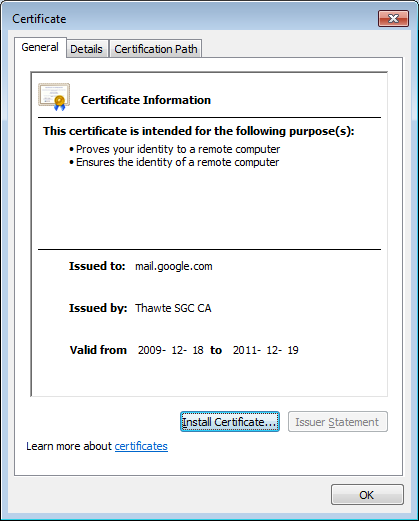
Extracted file mail.google.com.cer opened for inspection

Self signed certificates, revoked certificates and certificates that are signed by non-trusted CAs are generally not to be trusted. Finding such certificates in a pcap file can suggest that an SSL MITM attack has taken place. In this case, however, the certificate for mail.google.com seems to be signed properly by Thawte.

The recent attack on Comodo teaches us that even certificates signed by a trusted CA can be rogue, we can therefore not fully trust this certificate even though it is signed by Thawte. An attacker who has hacked into Thawte could have been able to apply a valid Thawte signature to his own fake certificate for mail.google.com. There is also the possibility that some governments might use MITM and false SSL certificates to inspect the contents of encrypted communications. Christopher Soghoian and Sid Stamm's paper “Certified Lies: Detecting and Defeating Government Interception Attacks Against SSL” does for example start out with the following abstract:

“This paper introduces a new attack, the compelled certificate creation attack, in which government agencies compel a certificate authority to issue false SSL certificates that are then used by intelligence agencies to covertly intercept and hijack individuals' secure Web-based communications. We reveal alarming evidence that suggests that this attack is in active use. [...]”

This type of advanced MITM attack, where the certificate is signed by a trusted CA, can be detected by investigating whether or not other people across the internet are receiving the same certificate as you do for a particular website. The Perspectives Project, which is run by Carnegie Mellon School of Computer Science, provides a web based Perspectives Notary Demo that can be used to query their “network notary” servers to see what SSL certs they receive for a particular HTTPS website.

By submitting a query for SSL certificates on TCP 443 on mail.google.com to Perspectives I get the following response:

*** cmu.ron.lcs.mit.edu:8080 ***
Key = 52:12:a2:b1:27:e3:bb:cc:e5:f5:aa:bd:a1:a1:e6:f8
start: Mon Jan 24 11:02:00 2011
end : Sun Mar 27 03:11:18 2011

*** convoke.ron.lcs.mit.edu:8080 ***
Key = d9:4a:90:07:85:f6:83:cd:71:e4:a9:d1:2d:1b:e8:29
start: Mon Jul 6 20:59:14 2009
end : Wed Nov 18 03:15:36 2009
start: Wed Nov 25 15:17:24 2009
end : Thu Dec 10 03:21:52 2009
Key = 0b:d9:68:74:0c:fb:70:8a:91:77:6b:1a:2e:f3:50:2c
start: Wed Nov 18 03:15:37 2009
end : Wed Nov 25 15:17:23 2009
start: Thu Dec 10 03:21:53 2009
end : Wed Dec 23 03:29:22 2009
Key = 52:12:a2:b1:27:e3:bb:cc:e5:f5:aa:bd:a1:a1:e6:f8
start: Wed Dec 23 03:29:23 2009
end : Sat Mar 26 16:06:14 2011

*** mvn.ron.lcs.mit.edu:8080 ***
Key = 52:12:a2:b1:27:e3:bb:cc:e5:f5:aa:bd:a1:a1:e6:f8
start: Fri Jan 21 17:21:53 2011
end : Sun Mar 27 03:44:32 2011

*** hostway.ron.lcs.mit.edu:8080 ***
Key = d9:4a:90:07:85:f6:83:cd:71:e4:a9:d1:2d:1b:e8:29
start: Wed May 6 10:47:37 2009
end : Tue Nov 24 15:46:54 2009
start: Wed Nov 25 15:46:34 2009
end : Wed Dec 9 16:04:13 2009
Key = 0b:d9:68:74:0c:fb:70:8a:91:77:6b:1a:2e:f3:50:2c
start: Tue Nov 24 15:46:55 2009
end : Wed Nov 25 15:46:33 2009
start: Wed Dec 9 16:04:14 2009
end : Tue Dec 22 15:58:32 2009
Key = 52:12:a2:b1:27:e3:bb:cc:e5:f5:aa:bd:a1:a1:e6:f8
start: Tue Dec 22 15:58:33 2009
end : Sun Mar 27 03:41:06 2011

The 16-byte keys received from the four network notary servers are MD5 fingerprints for the certificates they have seen. The built in certificate viewer in Windows unfortunately only shows SHA1 fingerprints (20 bytes), we will therefore need to find some other way of computing an MD5 fingerprint of the certificate. I chose to do this by running OpenSSL in Cygwin, but installing Win32 OpenSSL works just as fine. Calculating the MD5 fingerprint of an SSL certificate with OpenSSL is done like this:

$ openssl x509 -inform DER -in mail.google.com.cer -noout -fingerprint -md5
MD5 Fingerprint=52:12:A2:B1:27:E3:BB:CC:E5:F5:AA:BD:A1:A1:E6:F8

As you can see this fingerprint was also provided by all the four network notaries, so we can assume that no SSL MITM attack was performed on the session between 10.33.134.158 and mail.google.com in test1.pcap.

If you wanna learn more about sniffing and analyzing SSL/TLS encrypted network traffic then I suggest you also read our recent blog posts titled Facebook, SSL and Network Forensics and Webmail-Information-Leakage.

Posted by Erik Hjelmvik on Sunday, 27 March 2011 13:31:00 (UTC/GMT)

Tags: #Netresec

Share: Facebook   Twitter   Reddit   Hacker News Short URL: https://netresec.com/?b=11310EE


Sniffing Tutorial part 2 - Dumping Network Traffic to Disk

disk II

This blog post is the second part of a two-part tutorial that shows how to sniff network traffic. The first part covered how to intercept the traffic, i.e. how to get the packets to arrive to your network card. This second part covers how to best capture the network traffic to disk once you've managed to have them sent to your network card.

The first thing I recommend you to do before you start sniffing is to ensure that your sniffer computer stays quiet, so that you don't pollute the sniffed traffic with packets from your sniffer computer. How to do this varies between Windows, Linux and FreeBSD, so I will briefly cover how to silence all three OS's.

Silencing Windows

Windows is normally quite chatty on the network, but there is a simple trick that makes it shut up without disconnecting it from the network. Simply bring up the properties window for your network adapter and un-check all clients, services and protocols from the list of used items.

Local Area Connection Properties

Silencing Linux

I don't know any good way to disable the TCP/IP stack in Linux similar to what we just did to Windows. But by disabling ARP and not giving the interface any IP address the risk of leaking packets can be reduced significantly. To achieve this you'll also need to set the interface to promiscuous mode and disable IPv6. Here's an example of how this can be done in Debian/Ubuntu:

# ifconfig eth0 -arp up
# ifconfig eth0 promisc
# ip addr del 192.168.3.4/24 dev eth0
# ifconfig eth0 del fe80::1234:ddff:fe3f:1337/64
However, in general it is better to configure the sniffer interface by modifying /etc/network/interfaces to look as follows:
auto eth0
  iface eth0 inet manual
  up ifconfig $IFACE -arp up
  up ip link set $IFACE promisc on
  down ip link set $IFACE promisc off
  down ifconfig $IFACE down

For more details on shuting up your Linux machine I suggest you take a look at the “Undetectable Sniffing On Ethernet” blog post on the Ask Apache blog. I also recommend reading the Ubuntu instructions at the NetworkConfiguration wiki page for Security Onion.

Silencing FreeBSD

One of the many great things about FreeBSD is that it is really easy to configure a network interface to be silent. All you need to do is to issue this single command:

# ifconfig em0 monitor up

Read Richard Bejtlich's blog post “Ifconfig Monitor Option” for more info about this command.

Sniff with dumpcap

The most common software used for sniffing traffic is undoubtedly Wireshark, other common tools are tshark and tcpdump. All these three tools parse the packets as they come in and show data about the sniffed packets in the GUI or on the command line. This isn't desirable when doing network forensics since these application could use up too much resources on parsing the incoming packets, which during traffic peaks can lead to packets being dropped. There might also be bugs in the packet parsing code that can cause the application to crash completely, there have been plenty of such bugs in Wireshark for example.

A much more reliable way to sniff traffic is therefore to use an application that is designed to reliably dump traffic to disk, without trying to parse or analyze the contents of the sniffed frames. One such application is dumpcap, which is a command line tool developed by the Wireshark crew. In fact, as of version 1.4.0 of Wireshark both tshark and Wireshark run dumpcap in the background rather than doing the sniffing themselves. Another great thing about dumpcap is that it is available on Windows as well as on Linux and FreeBSD. My recommendation is to run it under FreeBSD since I consider it to be more reliable than the other operating systems. In order to get dumcap you need to download either Wireshark or tshark since dumpcap doesn't have an installation package of its own.

Dumpcap supports capture filtering with BPF, but I recommend that you sniff ALL packets if you are authorized to do so and have enough disk space. It is much better to do the filtering later on in the analysis phase. The feature I like best in dumpcap is the ring buffer functionality, where it will continue writing incoming frames to a new pcap file once the old one has reached a specific size limit. In order to have dumpcap write sniffed frames to disk and roll over to a new file when it reaches 100.000 kB you'd run this command:

# dumpcap -i em0 -w wiretap.pcap -b filesize:100000

When you've dumped the traffic to disk is when the fun starts, i.e. analyzing the pcap files. You can read more analyzing pcap files in my blog posts about the TCP/IP Weapons School Sample Lab, DFRWS 2009 Challenge, Webmail Information Leakage and Command-line forensics.

Posted by Erik Hjelmvik on Friday, 11 March 2011 16:56:00 (UTC/GMT)

Tags: #dumpcap#Wireshark#tshark#dump#pcap

Share: Facebook   Twitter   Reddit   Hacker News Short URL: https://netresec.com/?b=1135E10


Sniffing Tutorial part 1 - Intercepting Network Traffic

A cow's nose

This blog post is the first part of a two-part tutorial that shows how to sniff network traffic. This first part covers how to intercept the traffic, i.e. how to get the packets to arrive to your network card. The second part covers how to best capture the network traffic to disk once you've managed to have them sent to your network card.

I divide the field of network forensics and network security monitoring into two disciplines; capturing (a.k.a. sniffing) the traffic and analyzing the captured traffic. Analyzing the network traffic can be done on many different levels, from the novice's level where IP addresses and layer 7 protocols are listed to the expert who understands all protocol layers and can investigate traffic packet-by-packet. Network traffic analysis is a field where there is always something more to learn and where nobody, not even an expert like Richard Bejtlich, knows everything. Capturing traffic, on the other hand, is more like a craftsmanship; it takes a while to learn how to do it properly, but there is not much new to learn once you've gotten the hang of it. Being able to capture network traffic reliably is, however, essential in order to perform network traffic analysis or network forensics, which is why I decided to write this sniffing tutorial.

Many “n00bs” fire up Wireshark on their own PC expecting to be able to sniff all traffic passing through an Ethernet network. But the 90's are long gone, and all hubs have been replaced by switches, so your NIC nowadays only gets broadcast packets and packets addressed to your NIC. So if you wanna capture traffic from other hosts on the network you somehow need to force that traffic to passes by your NIC. I will here explain some of the most usual ways to achieve this.

Use a legacy “dumb” hub

4 port Netgear Ethernet hub

The good ol' dumb hubs (a.k.a. active hubs) are hard to find these days, but if you're fortunate enough to own one of those old jewels then make sure to hold on to it. You might also get lucky and find a used hub on ebay. These beauties repeat all Ethernet frames arriving at one port to all the other ports on the hub, which is just what we want in order to sniff all the traffic. Just place the hub at a choke-point in your network, for example between your firewall and the rest of the network, and connect your sniffer PC directly to the hub (see my ASCII image below).

Hub in choke-point

One downside of using a hub is that all these extra packets being sent on all the hub's ports increase the risk of packet collisions, i.e. when two nodes on a shared media network are transmitting at the same time. Every time a collision occurs on an Ethernet network the nodes on the shared media segment will pause for a random time before they continue sending data, this functionality is called CSMA/CD. For TCP based protocols such collisions result in lots of ugly retransmissions, while the data in collided UDP packets never will reach their destination since UDP doesn't support retransmissions.

Configure a monitor port on a managed switch

Network switches

A much better solution than using a hub is to configure a monitor port on a managed switch, from which you wish to tap some traffic. Monitor ports have different names depending on the vendor, Cisco call theirs SPAN ports, others use the term “port mirroring”. A monitor port is typically configured so that it copies all sent and received frames for a particular port to a monitor port, which is where you connect your sniffer. You can normally also configure the switch to copy traffic from all ports to the monitor port, but this can cause duplicate packets since each packet will be copied both when coming in on one port as well as when it goes out on another port. It is therefore usually better to monitor only the uplink port if you wish to monitor all hosts connected to a switch.

The major downside of sniffing traffic of a monitor port is that the primary functionality of a switch is to forward traffic from the sender to the receiver, not to send copies of that traffic to a monitor port. This means that if there is a high load on the switch it will prioritize sending the received frames to the recipient over copying them to the monitor port. You therefore run the risk of not always getting all transmitted packets to your monitor port, which might be acceptable in some situations but isn't acceptable in a network forensics investigation. Finding out if your monitor port has missed some packets isn't easy, but Charles Smutz explains how this can be done in his blog post “Flushing out Leaky Taps”.

Network Tap

The most reliable way to sniff traffic is to use a network tap. A network tap is a “bump-in-the-wire” device designed only to copy traffic passing through it to a monitor port. You typically insert a network tap inline between two nodes in a network, such as between your firewall and your first switch. A good network tap will cost you at least 1.000 EUR, but those are money well spent if you wanna be able to perform reliable network monitoring.

If you're planning to buy a network tap I recommend getting a link aggregation tap, which can merge uplink and downlink traffic to one single monitor port. This way you don't need two network interfaces on your sniffer PC. Both major tap vendors Net Optics and VSS Monitoring sell aggregation taps.

A downside of using a network tap compared to configuring a monitor port is that there will be a short downtime on the network while connecting and disconnecting the tap. I therefore recommend to install network taps when you have a service window. And when you have a tap connected at a good choke-point in your network I recommend that you leave it there after you're done, since you never know when you might need to come back and sniff some more.

ARP poisoning

A technique commonly used by hackers and penetration testers for getting hold of traffic in a switched environment is to use ARP poisoning. Basically ARP poisoning is a technique where two hosts on a network are tricked into sending packets destined for each other to a sniffer machine on the network. I'm not gonna describe this method in any more detail than so since ARP poisoning is a technique that I don't recommend using. Tools used for performing ARP poisoning are hacker tools like Cain & Abel and Ettercap. Another similar technique that I also don't recommend using is overflowing the CAM table.

Still not bored?

If you wanna learn even more about setting up monitor ports and sniffing traffic I recommend that you take a look at Betty DuBois' presentation titled “BU-11: SPAN/Mirror/Monitor vs. Taps: When should I use what, and why should I care?” from Sharkfest '09.

There is also a great list of various network tapping options over at the Argus website.

Continue reading part 2 of this sniffing tutorial, where I cover how to dump the traffic to disk.

Posted by Erik Hjelmvik on Friday, 11 March 2011 16:52:00 (UTC/GMT)

Tags: #Sniff#Capture#Monitor#ASCII-art

Share: Facebook   Twitter   Reddit   Hacker News Short URL: https://netresec.com/?b=113EA66


Command-line Network Forensics with NetworkMinerCLI

NetworkMinerCLI is a Command Line Interface version of NetworkMiner Professional. Apart from being faster than the GUI version NetworkMinerCLI also has the benefit of being easy to integrate into scripts of various kinds (Batch / perl / python / PowerShell / etc).

Running NetworkMinerCLI.exe from your NetworkMiner Professional USB flash drive shows the syntax and arguments to use:

F:\NetworkMinerProfessional_1-0>NetworkMinerCLI.exe
Usage: F:\NetworkMinerProfessional_1-0\NetworkMinerCLI.exe [OPTIONS]

 -r <input_file>        : Set the pcap file to read
 -w <output_directory>  : Directory to store output files in
 -b <frame_buffer_size> : Number of frames to buffer in memory (5000 = default)
 -noHeader              : Disables column headers for CSV files

Example: F:\NetworkMinerProfessional_1-0\NetworkMinerCLI.exe -r evidence.pcap -w D:\exported_data\

When a pcap is loaded by NetworkMinerCLI it will generate eight CSV files containing data about Sessions, Parameters, Credentials, CleartextWords, DnsRecords, FileInfos, Messages and Hosts. All assembled files will also be written to disk. The assembled files, as well as the seven CSV files, are written to the current working directory or to the directory specified with the -w argument.

This is what it looks like when loading suspect.pcap from the DFRWS 2008 challenge into NetworkMinerCLI (don't let my Swedish cmd.exe shell confuse you):

F:\pcap_files\DFRWS\Challenge 2008>F:\NetworkMinerProfessional_1-0\NetworkMinerCLI.exe -r suspect.pcap
Closing file handles...
10243 frames parsed in 56,084 seconds.

F:\pcap_files\DFRWS\Challenge 2008>dir
 Volymen i enhet F har etiketten NETRESEC
 Volymens serienummer är 7017-B488

 Innehåll i katalogen F:\pcap_files\DFRWS\Challenge 2008

2011-02-23 21:19 <KAT>        .
2011-02-23 21:19 <KAT>        ..
2007-12-16 23:32    5 110 493 suspect.pcap
2011-03-04 17:20 <KAT>        AssembledFiles
2011-03-04 17:21       15 098 suspect.pcap.Sessions.csv
2011-03-04 17:21      459 868 suspect.pcap.Parameters.csv
2011-03-04 17:21       83 034 suspect.pcap.Credentials.csv
2011-03-04 17:21    3 271 213 suspect.pcap.CleartextWords.csv
2011-03-04 17:21       23 748 suspect.pcap.DnsRecords.csv
2011-03-04 17:21      182 382 suspect.pcap.FileInfos.csv
2011-03-04 17:21          837 suspect.pcap.Messages.csv
2011-03-04 17:21        8 009 suspect.pcap.Hosts.csv
             9 fil(er)       9 154 682 byte
             3 katalog(er) 711 819 264 byte ledigt

F:\pcap_files\DFRWS\Challenge 2008>

I've uploaded the generated suspect.pcap.Parameters.csv file so that you can have a look at what the CSV files from NetworkMiner look like. Corey Harrell has by the way recently written a great blog post on how to do forensic work with CSV files in OpenOffice Calc on his Journey into Incident Response Methodology blog.

The CSV files can also be parsed directly from command line with help of some script-fu. I admit being a Windows nerd, but I have still not gone through the pain of learning Windows PowerShell properly. I therefore prefer to use Cygwin, or actually xterm in Cygwin/X, in order to assemble the power of the GNU bash shell while running Windows. I can for example use the following command in order to get a list of all detected gmail accounts and the logged in clients' IPs:

cat suspect.pcap.Parameters.csv | grep gmailchat | awk -F',' '{print $1" "$9}' | sort -u
192.168.151.130 steve.vogon@gmail.com/244489

Here is a short explanation of the command above for people without UNIX fingers:

  • grep gmailchat : selects all lines in the csv file containing the string “gmailchat”
  • awk -F',' '{print $1" "$9}' : tokenize text between commas and display first token (IP address) and ninth token (gmail account)
  • sort -u : sort each outputed line and only display unique lines (remove duplicates)

The same method can also be used in order to quickly filter out Google searches from a pcap file (remember that the search strings are sent to Google with the 'q' parameter):

cat suspect.pcap.Parameters.csv | grep 'HTTP QueryString,q,'|awk -F',' '{print $1" "$9}'
192.168.151.130 overseas credit card payments
192.168.151.130 hurricane

Or to get all the frame numbers (in the pcap file) where the word “bank” has been sent in clear text:

grep bank suspect.pcap.CleartextWords.csv -i | awk -F',' '{print$1" "$2}' | sort -u
Bank 1551
Bank 1553
Bank 1559
Bank 1566
Bank 1568
Bank 1617
Bank 1619
Bank 1629
Bank 1708
Bank 1710
Bank 1716
Bank 1724
bank 2063
banks 5797

It should also be noted that NetworkMinerCLI extracts and writes all identified files to disk, just as the normal GUI version of NetworkMiner Professional does. A good overview of these extracted files can be found in the suspect.pcap.FileInfos.csv CSV file. So if you are looking for a particular file you can search the suspect.pcap.FileInfos.csv for the MD5 sum like this:

grep e516cd1dbad131024693d31155a6577f suspect.pcap.FileInfos.csv | awk -F',' '{print $9" "$5}'
e516cd1dbad131024693d31155a6577f XRamp Security Services G.cer
e516cd1dbad131024693d31155a6577f XRamp Security Services G[1].cer
e516cd1dbad131024693d31155a6577f XRamp Security Services G[2].cer

In order to get your hands on a copy of the NetworkMinerCLI tool you need to buy a license for NetworkMiner Professional, since the USB flash drive contains the GUI as well as the CLI version of NetworkMiner Professional.

Posted by Erik Hjelmvik on Friday, 04 March 2011 17:12:00 (UTC/GMT)

Tags: #NetworkMinerCLI#DFRWS

Share: Facebook   Twitter   Reddit   Hacker News Short URL: https://netresec.com/?b=11346EC


Hak5 Crack the Code Challenge

Last week I did a blog post about NetworkMiner videos on the Internet. Just a couple of days later the Hak5 crew published a Crack the Code Challenge where NetworkMiner was included as part of the challenge zip file. The solution and winners of this challenge were announced on the Hak5 Episode 902.

The Crack the Code Challenge is covered 10 minutes into the video.

Posted by Erik Hjelmvik on Thursday, 03 March 2011 20:45:00 (UTC/GMT)

Tags: #NetworkMiner#Video

Share: Facebook   Twitter   Reddit   Hacker News Short URL: https://netresec.com/?b=113BC27

X / twitter

NETRESEC on X / Twitter: @netresec

Mastodon

NETRESEC on Mastodon: @netresec@infosec.exchange