Showing blog posts from 2013

rss Google News

Command-line Forensics of hacked PHP.net

Update: October 29

@StopMalvertisin recently published a great blog post that covered the five binaries that were served with help of the PHP.net compromise. We've therefore updated this blog post with a few of their findings in order to give a more complete picture of the events.
LSI and Monitor playing KALISCOP by DanCentury

The good people from Barracuda Labs were kind enough to share a PCAP file from the PHP.net compromize on their blog.

I decided to have a closer look at that PCAP file to see what can be extracted from it. Since the PCAP contains Windows malware I played safe and did all the analysis on a Linux machine with no Internet connectivity.

For no particluar reason I also decided to do all the analysis without any GUI tools. Old skool ;)


~/Desktop$ capinfos barracuda.pcap
File name:           barracuda.pcap
File type:           Wireshark/tcpdump/... - libpcap
File encapsulation:  Ethernet
Number of packets:   1403
File size:           1256656 bytes
Data size:           1234184 bytes
Capture duration:    125 seconds
Start time:          Tue Oct 22 19:27:36 2013
End time:            Tue Oct 22 19:29:41 2013
Data byte rate:      9897.42 bytes/sec
Data bit rate:       79179.33 bits/sec
Average packet size: 879.67 bytes
Average packet rate: 11.25 packets/sec

We can see that the PCAP is from October 22, i.e. the traffic was captured at least one day before Google Safe Browsing started alerting users that PHP.net was hosting malware. Barracuda Labs made the PCAP file public on October 24.

A good start is to look at IP's and hostnames based on DNS traffic. Tshark can give a nice hosts-file formatted output with the following command:

~/Desktop$ tshark -r barracuda.pcap -q -z hosts
# TShark hosts output
#
# Host data gathered from barracuda.pcap

69.147.83.199   php.net
69.147.83.201   y3b.php.net
91.214.203.236  url.whichusb.co.uk
91.214.203.240  aes.whichdigitalphoto.co.uk
144.76.192.102  zivvgmyrwy.3razbave.info
108.168.255.244 j.maxmind.com
74.125.224.146  www.google.com
74.125.224.148  www.google.com
74.125.224.147  www.google.com
74.125.224.144  www.google.com
74.125.224.145  www.google.com
95.106.70.103   uocqiumsciscqaiu.org
213.141.130.50  uocqiumsciscqaiu.org
77.70.85.108    uocqiumsciscqaiu.org
69.245.241.238  uocqiumsciscqaiu.org
78.62.94.153    uocqiumsciscqaiu.org
83.166.105.96   uocqiumsciscqaiu.org
89.215.216.111  uocqiumsciscqaiu.org
176.219.188.56  uocqiumsciscqaiu.org
94.244.141.40   uocqiumsciscqaiu.org
78.60.109.182   uocqiumsciscqaiu.org
213.200.55.143  uocqiumsciscqaiu.org

Several of these hostnames look suspicious; two of them look as if they have been produced by a domain generation algorithm (DGA). However, before proceeding with analyzing these domains I'll also run the PCAP through httpry in order to generate a web-proxy-like log.

~/Desktop/php-net$ httpry -r ../barracuda.pcap 'dst port 80'
httpry version 0.1.6 -- HTTP logging and information retrieval tool
Copyright (c) 2005-2011 Jason Bittel <jason.bittel@gmail.com>
192.168.40.10 69.147.83.199 > GET php.net /
192.168.40.10 69.147.83.201 > GET static.php.net /www.php.net/styles/phpnet.css
192.168.40.10 69.147.83.201 > GET static.php.net /www.php.net/styles/site.css
192.168.40.10 69.147.83.201 > GET static.php.net /www.php.net/userprefs.js
192.168.40.10 69.147.83.201 > GET static.php.net /www.php.net/styles/print.css
192.168.40.10 69.147.83.201 > GET static.php.net /www.php.net/images/php.gif
192.168.40.10 69.147.83.201 > GET static.php.net /www.php.net/images/small_submit_white.gif
192.168.40.10 69.147.83.201 > GET static.php.net /www.php.net/images/leftbar.png
192.168.40.10 69.147.83.201 > GET static.php.net /www.php.net/images/rightbar.png
192.168.40.10 91.214.203.236 > GET url.whichusb.co.uk /stat.htm
192.168.40.10 91.214.203.236 > GET url.whichusb.co.uk /PluginDetect_All.js
192.168.40.10 91.214.203.236 > POST url.whichusb.co.uk /stat.htm
192.168.40.10 91.214.203.240 > GET aes.whichdigitalphoto.co.uk /nid?1
192.168.40.10 144.76.192.102 > GET zivvgmyrwy.3razbave.info /?695e6cca27beb62ddb0a8ea707e4ffb8=43
192.168.40.10 144.76.192.102 > GET zivvgmyrwy.3razbave.info /b0047396f70a98831ac1e3b25c324328/8fdc5f9653bb42a310b96f5fb203815b.swf
192.168.40.10 144.76.192.102 > GET zivvgmyrwy.3razbave.info /b0047396f70a98831ac1e3b25c324328/b7fc797c851c250e92de05cbafe98609
192.168.40.10 144.76.192.102 > GET 144.76.192.102 /?9de26ff3b66ba82b35e31bf4ea975dfe
192.168.40.10 144.76.192.102 > GET 144.76.192.102 /?90f5b9a1fbcb2e4a879001a28d7940b4
192.168.40.10 144.76.192.102 > GET 144.76.192.102 /?8eec6c596bb3e684092b9ea8970d7eae
192.168.40.10 144.76.192.102 > GET 144.76.192.102 /?35523bb81eca604f9ebd1748879f3fc1
192.168.40.10 144.76.192.102 > GET 144.76.192.102 /?b28b06f01e219d58efba9fe0d1fe1bb3
192.168.40.10 108.168.255.244 > GET j.maxmind.com /app/geoip.js
192.168.40.10 74.125.224.146 > GET www.google.com /
192.168.40.10 144.76.192.102 > GET 144.76.192.102 /?52d4e644e9cda518824293e7a4cdb7a1
192.168.40.10 95.106.70.103 > POST uocqiumsciscqaiu.org /
192.168.40.10 74.125.224.146 > GET www.google.com /
26 http packets parsed

url.whichusb.co.uk

We can see that the first HTTP request outside of php.net was a GET reguest for url.whichusb.co.uk/stat.htm. Let's extract this file (and all the other ones) to disk with NetworkMinerCLI, i.e. the command line version of NetworkMiner Professional. NetworkMinerCLI works just fine in Linux (if you have installed Mono) and it's perfect when you wanna automize content extraction from PCAP files, since you can script it to extract metadata and files to disk from the captured packets.

~/Desktop$ mkdir php-net
~/Desktop$ NetworkMinerCLI.exe -r barracuda.pcap -w php-net

NetworkMinerCLI has now produced multiple CSV files that we can grep in (or load into Excel / OpenOffice). The “AssembledFiles” directory contains the files that have been extracted from the packets.

~/Desktop/php-net$ ls
AssembledFiles
barracuda.pcap.CleartextWords.csv
barracuda.pcap.Credentials.csv
barracuda.pcap.DnsRecords.csv
barracuda.pcap.FileInfos.csv
barracuda.pcap.Hosts.csv
barracuda.pcap.Parameters.csv
barracuda.pcap.Sessions.csv

~/Desktop/php-net$ cat AssembledFiles/91.214.203.236/HTTP\ -\ TCP\ 80/stat.htm

<html>
<head>
<script type="text/javascript" src="PluginDetect_All.js"></script>
</head>
<body>
<script>
var os=0;
try
{
var os=PluginDetect.OS;
}
catch(e){}
var jav=0;
try
{
//var javaversion=PluginDetect.getVersion('Java','./getjavainfo.jar');
var javaversion=0;
if(javaversion!=null)
{
jav=1;
}
}
catch(e){}
var acrobat=new Object();
acrobat.installed=false;
acrobat.version=0;
var pdfi=0;
try
{
var adobe=PluginDetect.getVersion("AdobeReader");
if(adobe!=null)
{
pdfi=1;
}
}
catch(e){}
var resoluz=0;
try
{
resoluz=screen.width;
}
catch(e){}
document.write('<form action="stat.htm" method="post"><input type="hidden" name="id" value="" />');
var id=resoluz+'|'+jav+'|'+pdfi;
var frm=document.forms[0];
frm.id.value=id;
frm.submit();
</script>
</body>
</html>

The bold part of this java script does a HTTP POST back to stat.htm with a parameter named id and a value in the following format: "ScreenResolutionWidth|Java(1/0)|AdobeReader(1/0)"

The Parameters.csv contains all text based variables and parameters that have been extracted from the PCAP file. I should therefore be able to find the contents of this HTTP POST inside that CSV file.

~/Desktop/php-net$ grep POST barracuda.pcap.Parameters.csv 192.168.40.10,TCP 1040,91.214.203.236,TCP 80,147,10/22/2013 7:27:54 PM,HTTP POST,id,800|1|1

Yep, the following data was posted back to stat.htm (which we expect is under the attacker's control):

Width = 800px
Java = 1 (true)
AdobeReader = 1 (true)

zivvgmyrwy.3razbave.info

The first DGA-like URL in the list above was zivvgmyrwy.3razbave.info. Let's proceed by grepping for the DGA hostname and its IP.

~/Desktop/php-net$ grep zivvgmyrwy barracuda.pcap.Hosts.csv | cut -d, -f 1,3,5
144.76.192.102,"zivvgmyrwy.3razbave.info,DE Germany

~/Desktop/php-net$ grep 144.76.192.102 barracuda.pcap.FileInfos.csv | cut -d, -f 1,9,10
144.76.192.102,50599e6c124493994541489e00e816e3,3C68746D<htm
144.76.192.102,8943d7a67139892a929e65c0f69a5ced,3C21444F<!DO
144.76.192.102,97017ee966626d55d76598826217801f,3C68746D<htm
144.76.192.102,dc0dbf82e756fe110c5fbdd771fe67f5,4D5A9000MZ..
144.76.192.102,406d6001e16e76622d85a92ae3453588,4D5A9000MZ..
144.76.192.102,d41d8cd98f00b204e9800998ecf8427e,
144.76.192.102,c73134f67fd261dedbc1b685b49d1fa4,4D5A9000MZ..
144.76.192.102,18f4d13f7670866f96822e4683137dd6,4D5A9000MZ..
144.76.192.102,78a5f0bc44fa387310d6571ed752e217,4D5A9000MZ..

These are the MD5-sums of the files that have been downloaded from that suspicious domain. The last column (column 10 in the original CSV file) is the file's first four bytes in Hex, followed by an ASCII representation of the same four bytes. Hence, files starting with 4D5A (hex for “MZ”) are typically Windows PE32 binaries. We can see that five PE32 files have been downloaded from 144.76.192.102.

All the listed files have also been carved to disk by NetworkMinerCLI. We can therefore have a quick look at the extracted files to see if any of them uses the IsDebuggerPresent function, which is a common anti-debugging technique used by malware to avoid sanboxes and malware analysts.

~/Desktop/php-net$ fgrep -R IsDebuggerPresent AssembledFiles
Binary file AssembledFiles/144.76.192.102/HTTP - TCP 80/index.html.A62ECF91.html matches
Binary file AssembledFiles/144.76.192.102/HTTP - TCP 80/index.html.63366393.html matches
Binary file AssembledFiles/144.76.192.102/HTTP - TCP 80/index.html.6FA4D5CC.html matches
Binary file AssembledFiles/144.76.192.102/HTTP - TCP 80/index.html.51620EC7.html matches

uocqiumsciscqaiu.org

The other odd looking domain name was “uocqiumsciscqaiu.org” that seems to be pointing to a whole array of IP addresses. Let's see what we can find out about this domain:

~/Desktop/php-net$ grep uocqiumsciscqaiu barracuda.pcap.Hosts.csv | cut -d, -f 1,3,4
95.106.70.103,uocqiumsciscqaiu.org,RU Russian Federation

It turns out that the PCAP file contains communication to one of the IP addresses associated with the “uocqiumsciscqaiu.org” domain. The server is located in Russia (according to MaxMind). Going back to our previous httpry log we can see that a HTTP POST was made to this domain. Let's see what content that was pushed out to that Russian server!

~/Desktop/php-net$ tshark -r ../barracuda.pcap -R "ip.addr eq 95.106.70.103 and http.request" -x

862 67.365496 192.168.40.10 -> 95.106.70.103 HTTP POST / HTTP/1.1

0000 0a b4 df 27 c2 b0 00 20 18 eb ca 28 08 00 45 00 ...'... ...(..E.
0010 01 05 02 96 40 00 80 06 68 d9 c0 a8 28 0a 5f 6a ....@...h...(._j
0020 46 67 04 2f 00 50 d3 80 46 2f e3 c6 b5 b5 50 18 Fg./.P..F/....P.
0030 ff ff b0 15 00 00 50 4f 53 54 20 2f 20 48 54 54 ......POST / HTT
0040 50 2f 31 2e 31 0d 0a 48 6f 73 74 3a 20 75 6f 63 P/1.1..Host: uoc
0050 71 69 75 6d 73 63 69 73 63 71 61 69 75 2e 6f 72 qiumsciscqaiu.or
0060 67 0d 0a 43 6f 6e 74 65 6e 74 2d 4c 65 6e 67 74 g..Content-Lengt
0070 68 3a 20 31 32 38 0d 0a 43 61 63 68 65 2d 43 6f h: 128..Cache-Co
0080 6e 74 72 6f 6c 3a 20 6e 6f 2d 63 61 63 68 65 0d ntrol: no-cache.
0090 0a 0d 0a 1c 61 37 c4 95 55 9a a0 1c 96 5a 0e e7 ....a7..U....Z..
00a0 f7 16 65 b2 00 9a 93 dc 21 96 e8 70 84 e8 75 6a ..e.....!..p..uj
00b0 04 e2 21 fb f1 2f 96 ce 4e 6c a8 f8 54 ac dd aa ..!../..Nl..T...
00c0 d5 fa c1 61 b5 ec 18 68 38 6e 3b ac 8e 86 a5 d0 ...a...h8n;.....
00d0 f2 62 73 6e ee 37 bc 40 3e 3d 22 0b fe 7c ca 9c .bsn.7.@>="..|..
00e0 49 39 2b d2 cb a2 ec 02 70 2b 58 de 24 75 61 21 I9+.....p+X.$ua!
00f0 85 c9 91 c1 7a ee 0b f7 fd 6c ef e6 c2 6e cb a9 ....z....l...n..
0100 fb ac 65 d8 78 87 fa e2 7f 05 13 a6 73 3d 27 b1 ..e.x.......s='.
0110 db c2 a7 ...

That looks quite odd. Most likely C2 communication or some form of encrypted channel for information leakage.
Update: Our friends from stopmalvertising.com confirm that this is C2 traffic from the downloaded Trojan with MD5 c73134f67fd261dedbc1b685b49d1fa4.

ZeroAccess Trojan

Running the PCAP through Snort will generate multiple alerts indicating that UDP traffic to port 53 might be C2 traffic from the ZeroAccess trojan.

10/22-20:28:38.363586 [**] [1:2015474:2] ET TROJAN ZeroAccess udp traffic detected [**] [Classification: A Network Trojan was Detected] [Priority: 1] {UDP} 192.168.40.10:1055 -> 85.114.128.127:53

There will also be another alert indicating ZeroAccess traffic, but this time for UDP port 16471:

10/22-20:28:57.501645 [**] [1:2015482:6] ET TROJAN ZeroAccess Outbound udp traffic detected [**] [Classification: A Network Trojan was Detected] [Priority: 1] {UDP} 192.168.40.10:1073 -> 219.68.96.128:16471

But when looking closer at the traffic for that alert we only see one outgoing packet, but no response. That wasn't very interesting. However, the rule that was triggered in this particular alert contained a threshold that suppressed alerts for ZeroAccess traffic to other IP addresses. Here is the syntax for the Snort rule:

alert udp $HOME_NET any -> $EXTERNAL_NET any (msg:"ET TROJAN ZeroAccess Outbound udp traffic detected"; content:"|28 94 8d ab c9 c0 d1 99|"; offset:4; depth:8; dsize:16; threshold: type both, track by_src, count 10, seconds 600; classtype:trojan-activity; sid:2015482; rev:4;)

We can use the content signature to search for other similar packets by using tshark like this:

~/Desktop/php-net$ tshark -R "udp and data.data contains 28:94:8d:ab:c9:c0:d1:99" -r ../barracuda.pcap -T fields -e ip.dst -e udp.port | sort -u
105.129.8.196 16471
111.119.186.150 16471
112.200.137.206 16471
113.162.57.138 16471
114.207.201.74 16471
118.107.222.161 16471
118.175.165.41 16471
121.73.83.62 16471
124.43.201.66 16471
153.166.2.103 16471
173.177.175.241 16471
178.34.223.52 16471
182.160.5.97 16471
185.12.43.63 16471
186.55.140.138 16471
186.88.99.237 16471
187.245.116.205 16471
190.206.224.248 16471
190.213.108.244 16471
197.228.246.213 16471
197.7.33.65 16471
201.1.171.89 16471
202.123.181.178 16471
202.29.179.251 16471
203.81.69.155 16471
212.85.174.80 16471
218.186.195.105 16471
219.68.96.128 16471
24.142.33.67 16471
27.109.17.227 16471
31.169.11.208 16471
37.229.237.130 16471
37.229.239.36 16471
37.237.75.66 16471
37.243.218.70 16471
37.49.224.148 16471
46.40.32.154 16471
50.81.51.167 16471
5.102.206.178 16471
5.12.127.206 16471
5.234.117.85 16471
5.254.141.186 16471
66.26.243.171 16471
70.45.207.23 16471
72.24.235.141 16471
72.252.207.108 16471
75.75.125.203 16471
78.177.67.219 16471
79.54.68.43 16471
84.202.148.220 16471
85.28.144.49 16471
88.222.114.18 16471
92.245.193.137 16471
93.116.10.207 16471
95.180.241.120 16471
95.68.74.55 16471

Wow, the ZeroAccess trojan's P2P C2 traffic sure is noisy, the threshold was probably there for a reason! But let's see which of these servers that actually reply to the ZeroAccess traffic:

~/Desktop/php-net$ tshark -r ../barracuda.pcap -R "udp.srcport eq 16471" -T fields -e ip.src > ZeroAccessHosts

~/Desktop/php-net$ fgrep -f ZeroAccessHosts 5f810408ddbbd6d349b4be4766f41a37.pcap.Hosts.csv | cut -d, -f 1,4

27.109.17.227,IN India
37.49.224.148,NL Netherlands
37.229.239.36,UA Ukraine
50.81.51.167,US United States
66.26.243.171,US United States
72.24.235.141,US United States
75.75.125.203,US United States
85.28.144.49,PL Poland
88.222.114.18,LT Lithuania
173.177.175.241,CA Canada
190.213.108.244,TT Trinidad and Tobago
201.1.171.89,BR Brazil

Sweet, those IP's are most likely infected with ZeroAccess as well.

Bonus Find

Barracuda Lab's public IP address for their malware analysis machine seems to be 64.235.155.80.

~/Desktop/php-net$ cut -d, -f1,3,4 barracuda.pcap.Credentials.csv | head -2
ClientIP,Protocol,Username
192.168.40.10,HTTP Cookie,COUNTRY=USA%2C64.235.155.80

Timeline

I've created a timeline of the events in the PCAP file provided by Barracuda Labs. This timeline is frame centric, i.e. frame number is used as the first identifier instead of a timestamp. This helps when you wanna find a particular event in the PCAP.

Frame Data Comment
15 Set-Cookie: COUNTRY=USA%2C64.235.155.80 The external IP of Barracuda's malware lab is stored as a cookie.
139 GET /www.php.net/userprefs.js The first entry of infection at PHP.net
147 POST url.whichusb.co.uk/stat.htm Width = 800px, Java = True, AcrobatReader = True
174 GET /b0047396f70a98831ac1e3b25c324328/ b7fc797c851c250e92de05cbafe98609 Triggers CVE-2013-2551 / MS13-037
213 Ransomware Zbot downloaded from 144.76.192.102 File details on VirusTotal or Anubis. MD5: dc0dbf82e756fe110c5fbdd771fe67f5
299 Ransomware Zbot downloaded from 144.76.192.102 File details on VirusTotal or Anubis. MD5: 406d6001e16e76622d85a92ae3453588
424 Trojan downloaded from 144.76.192.102 File details on VirusTotal or Anubis. MD5: c73134f67fd261dedbc1b685b49d1fa4
534 ZeroAccess Trojan downloaded from 144.76.192.102 File details on VirusTotal or Anubis. MD5: 18f4d13f7670866f96822e4683137dd6
728 GET /app/geoip.js HTTP/1.0 MaxMind query by ZeroAccess Trojan downloaded in frame 534
751 GET www.google.com Connectivity test by Trojan downloaded in frame 424
804 Vawtrak.A Backdoor / Password Stealer downloaded from 144.76.192.102 File details on VirusTotal or Anubis. MD5: 78a5f0bc44fa387310d6571ed752e217
862 HTTP POST to hxxp://uocqiumsciscqaiu.org C2 communication by Trojan downloaded in frame 424
1042 TCP 16471 First of the TCP-based ZeroAccess C2 channels
1036 UDP 16471 First UDP packet with ZeroAccess C2 data
1041 UDP 16471 first UDP ZeroAccess successful reply

Posted by Erik Hjelmvik on Monday, 28 October 2013 22:15:00 (UTC/GMT)

Tags: #Netresec#PCAP#ZeroAccess#NetworkMinerCLI#NetworkMiner

Share: Facebook   Twitter   Reddit   Hacker News Short URL: https://netresec.com/?b=13A552F


DNS whitelisting in NetworkMiner

Stack of Papers by Jenni C

One of the new features in NetworkMiner Professional 1.5 is the ability to check if domain names in DNS requests/responses are “normal” or malicious ones. This lookup is performed offline using a local copy of Alexa's top 1 million domain name list.
We got the idea for this feature via Jarno Niemelä's great presentation titled “Making Life Difficult for Malware”. Despite working for F-Secure Jarno presents several smart ideas for avoiding malware infections without having to install an AV-product.

One of Jarno's slides contains the following suggestions:

Block Traffic To Sites Your Users Don’t Go To

Block subdomain hosting TLDs
  • co.cc, co.tv, ce.ms, rr.nu, cu.cc, cz.cc, vv.cc, cw.cm, cx.cc, etc
Block domains that provide dynamic DNS
  • *dyndns*, *no-ip*, 8866.org, thescx.info, 3322.org, sock8.com
Block file sharing sites, some malware use them
  • fileleave.com, dropbox.com, rapidshare.com, megafiles.com
For strict policy, allow DNS resolving only to Alexa top 1M[1]
  • Tip: Instead of null routing domains set up landing page
  • Either with a link that allows domain or IT ticket

Preventing users from visiting sites outside of the top 1 million websites (according to Alexa) sounds a bit harsh. In fact, we at Netresec just recently made it into the top 1M list (the current rank for netresec.com is 726 922). There are also many good and legit sites that are not yet on this list. Our idea is, however, to give analysts a heads up on queried DNS names that are not on the top 1M list by displaying this information in NetworkMiner's DNS tab.

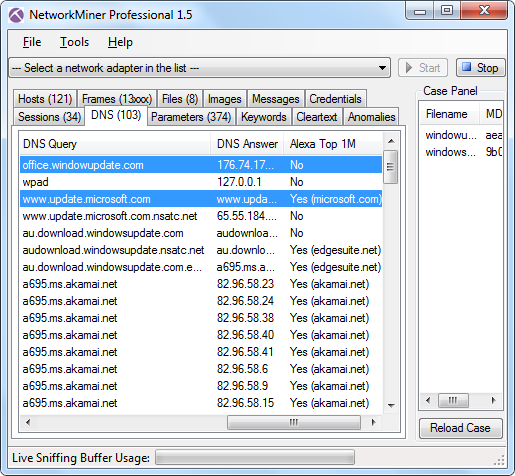
NetworkMiner Professional 1.5 with DNS tab showing Alexa result for office.windowupdate.com
The screenshot above contains a lookup for the domain “office.windowupdate.com” (note the missing “s” in “windows”). This domain name was previously used by the C2 protocol Lurk (see Command Five's report “Command and Control in the Fifth Domain” for more details). The “Alexa Top 1M” column in NetworkMiner's DNS tab indicates whether or not the domain name is a well known domain. The malicious “office.windowupdate.com” is marked with “No”, while the proper “www.update.microsoft.com” is indeed on the list. It is, however, important to note that only the second-level domain is checked by NetworkMiner; i.e. in this case “windowupdate.com” and “microsoft.com”.

The DNS whitelisting technique can also come in handy when dealing with malware that employs domain generation algorithms (DGAs) (see the Damballa blog for additional info regarding DGAs). It is probably safe to say that these auto-generated domains should never show up in the Alexa Top 1M list.

Posted by Erik Hjelmvik on Wednesday, 02 October 2013 22:30:00 (UTC/GMT)

Tags: #Netresec#DNS#domain#DGA#malware#Alexa

Share: Facebook   Twitter   Reddit   Hacker News Short URL: https://netresec.com/?b=13A66EB


New features in NetworkMiner 1.5

NetworkMiner 1.5 was released on August 7th, but we haven't yet provided any details regarding the new functionality that has been added.

NetworkMiner (free edition)

New features in the free and open source version of NetworkMiner:

  • Parser for PPPoE (RFC 2615)
  • Keywords can be loaded from text file (useful in investigations where you have lots of strings to search for)
  • Support for LLMNR DNS (RFC 4795) queries over UDP 5355

NetworkMiner Professional

The professional version of NetworkMiner additionally contains the following new features:

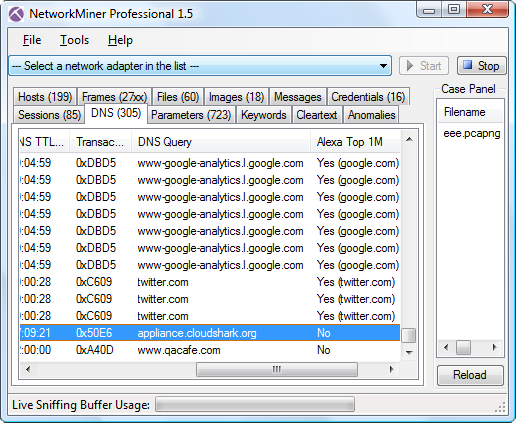
NetworkMiner Professional 1.5 with DNS tab
DNS tab in NetworkMiner Professional with eee.pcapng from CloudShark loaded.
Metadata in NetworkMiner Professional 1.5
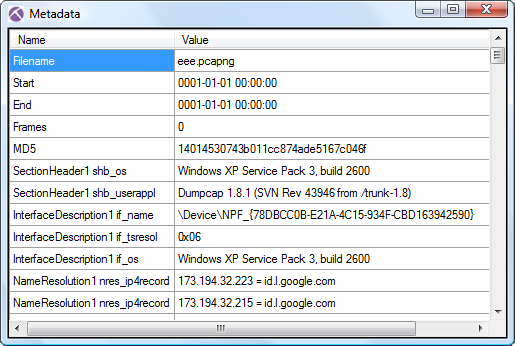
Metadata window in NetworkMiner Professional
In order to bring up the metadata window, simply right-click a PcapNG file in NetworkMiner's case panel and select "Show Metadata". The extracted metadata will normally contain info about the machine used to create the capture file, such as the OS and what sniffer that was used. Also, please note that some PcapNG files additionally contain name resolution blocks with cached DNS entries even if the corresponding traffic has been filtered from the capture file.

We hope you will find these new features useful!

Posted by Erik Hjelmvik on Sunday, 15 September 2013 21:03:00 (UTC/GMT)

Tags: #Netresec#PcapNG#NetworkMiner

Share: Facebook   Twitter   Reddit   Hacker News Short URL: https://netresec.com/?b=1390406


Security Advisory: Two Vulnerabilities in NetworkMiner

Security Advisory ID: NETRESEC-1386968

NetworkMiner version 1.4.1 and older is vulnerable to DLL hijacking and contains a directory traversal vulnerability.

NetworkMiner Logo

Description

NetworkMiner is a tool designed for network forensics and network security monitoring. It is primarily used in order to analyze captured network traffic in PCAP files, but can also be used for live sniffing.

NetworkMiner uses Dynamically Linked Libraries (DLLs) for parts of its functionality. The location of these DLLs are not specified using a fully qualified path name, which makes the application vulnerable to DLL hijacking. The DLL hijacking can occur if NetworkMiner is used to open a pcap file from an attacker-controlled directory.

An important part of NetworkMiner's functionality is the ability to extract files from sniffed network traffic. NetworkMiner supports file extraction from protocols such as HTTP, FTP, TFTP, SMB, SMTP and the OSCAR protocol (used by AOL's ICQ and AIM). Files extracted from network traffic are written to a sub-directory of NetworkMiner called ”AssembledFiles”. However, due to a directory traversal vulnerability in NetworkMiner, a malicious PCAP file loaded by NetworkMiner can cause files to be written to directories other than ”AssembledFiles”.

Impact

Both vulnerabilities can allow an attacker to execute arbitrary code on the victim's machine. For an attack to be successful the victim must open a specially crafted malicious PCAP file or open a PCAP file from an insecure location.

Solution

These two vulnerabilities have been fixed in NetworkMiner 1.5 and NetworkMiner Professional 1.5.

Please visit our NetworkMiner page to download the latest free version of NetworkMiner:
http://www.netresec.com/?page=Networkminer

Customers who have purchased a previous version of NetworkMiner Professional can download an update for free from our customer portal.

Credit Statement

We would like to thank Alyssa Milburn for reporting the directory traversal vulnerability and Ucha Gobejishvili for reporting the DLL hijacking vulnerability. We would also like to thank Jonas Lejon and Claus Valca for finding and reporting two bugs that now have been fixed in NetworkMiner 1.5.

External References

Posted by Erik Hjelmvik on Wednesday, 07 August 2013 18:55:00 (UTC/GMT)

Tags: #NetworkMiner#PCAP

Share: Facebook   Twitter   Reddit   Hacker News Short URL: https://netresec.com/?b=1386968


Detecting TOR Communication in Network Traffic

The anonymity network Tor is often misused by hackers and criminals in order to remotely control hacked computers. In this blog post we explain why Tor is so well suited for such malicious purposes, but also how incident responders can detect Tor traffic in their networks.

Yellow onions with cross section. Photo taken by Andrew c

The privacy network Tor (originally short for The Onion Router) is often used by activists and whistleblowers, who wish to preserve their anonymity online. Tor is also used by citizens of countries with censored Internet (like in China, Saudi Arabia and Belarus), in order to evade the online censorship and surveillance systems. Authorities in repressive regimes are therefore actively trying to detect and block Tor traffic, which makes research on Tor protocol detection a sensitive subject.

Tor is, however, not only used for good; a great deal of the traffic in the Tor networks is in fact port scans, hacking attempts, exfiltration of stolen data and other forms of online criminality. Additionally, in December last year researchers at Rapid7 revealed a botnet called “SkyNet” that used Tor for its Command-and-Control (C2) communication. Here is what they wrote about the choice of running the C2 over Tor:

"Common botnets generally host their Command & Control (C&C) infrastructure on hacked, bought or rented servers, possibly registering domains to resolve the IP addresses of their servers. This approach exposes the botnet from being taken down or hijacked. The security industry generally will try to take the C&C servers offline and/or takeover the associated domains
[...]
What the Skynet botnet creator realized, is that he could build a much stronger infrastructure at no cost just by utilizing Tor as the internal communication protocol, and by using the Hidden Services functionality that Tor provides."


Tor disguised as HTTPS

Tor doesn't just provide encryption, it is also designed to look like normal HTTPS traffic. This makes Tor channels blend in quite well with normal web surfing traffic, which makes Tor communication difficult to identify even for experienced incident responders. As an example, here is how tshark interprets a Tor session to port TCP 443:

$ tshark -nr tbot_2E1814CCCF0.218EB916.pcap | head
1 0.000000 172.16.253.130 -> 86.59.21.38 TCP 62 1565 > 443 [SYN] Seq=0 Win=64240 Len=0 MSS=1460 SACK_PERM=1
2 0.126186 86.59.21.38 -> 172.16.253.130 TCP 60 443 > 1565 [SYN, ACK] Seq=0 Ack=1 Win=64240 Len=0 MSS=1460
3 0.126212 172.16.253.130 -> 86.59.21.38 TCP 54 1565 > 443 [ACK] Seq=1 Ack=1 Win=64240 Len=0
4 0.127964 172.16.253.130 -> 86.59.21.38 SSL 256 Client Hello
5 0.128304 86.59.21.38 -> 172.16.253.130 TCP 60 443 > 1565 [ACK] Seq=1 Ack=203 Win=64240 Len=0
6 0.253035 86.59.21.38 -> 172.16.253.130 TLSv1 990 Server Hello, Certificate, Server Key Exchange, Server Hello Done
7 0.259231 172.16.253.130 -> 86.59.21.38 TLSv1 252 Client Key Exchange, Change Cipher Spec, Encrypted Handshake Message
8 0.259408 86.59.21.38 -> 172.16.253.130 TCP 60 443 > 1565 [ACK] Seq=937 Ack=401 Win=64240 Len=0
9 0.379712 86.59.21.38 -> 172.16.253.130 TLSv1 113 Change Cipher Spec, Encrypted Handshake Message
10 0.380009 172.16.253.130 -> 86.59.21.38 TLSv1 251 Encrypted Handshake Message

A Tor session to TCP port 443, decoded by tshark as if it was HTTPS

The thsark output above looks no different from when a real HTTPS session is being analyzed. So in order to detect Tor traffic one will need to apply some sort of traffic classification or application identification. However, most implementations for protocol identification rely on either port number inspection or protocol specification validation. But Tor often communicate over TCP 443 and it also follows the TLS protocol spec (RFC 2246), because of this most products for intrusion detection and deep packet inspection actually fail at identifying Tor traffic. A successful method for detecting Tor traffic is to instead utilize statistical analysis of the communication protocol in order to tell different SSL implementations apart. One of the very few tools that has support for protocol identification via statistical analysis is CapLoader.

CapLoader provides the ability to differentiate between different types of SSL traffic without relying on port numbers. This means that Tor sessions can easily be identified in a network full of HTTPS traffic.


Analyzing the tbot PCAPs from Contagio

@snowfl0w provides some nice analysis of the SkyNet botnet (a.k.a. Trojan.Tbot) at the Contagio malware dump, where she also provides PCAP files with the network traffic generated by the botnet.

The following six PCAP files are provided via Contagio:

  1. tbot_191B26BAFDF58397088C88A1B3BAC5A6.pcap (7.55 MB)
  2. tbot_23AAB9C1C462F3FDFDDD98181E963230.pcap (3.24 MB)
  3. tbot_2E1814CCCF0C3BB2CC32E0A0671C0891.pcap (4.08 MB)
  4. tbot_5375FB5E867680FFB8E72D29DB9ABBD5.pcap (5.19 MB)
  5. tbot_A0552D1BC1A4897141CFA56F75C04857.pcap (3.97 MB) [only outgoing packets]
  6. tbot_FC7C3E087789824F34A9309DA2388CE5.pcap (7.43 MB)

Unfortunately the file “tbot_A055[...]” only contains outgoing network traffic. This was likely caused by an incorrect sniffer setup, such as a misconfigured switch monitor port (aka SPAN port) or failure to capture the traffic from both monitor ports on a non-aggregating network tap (we recommend using aggregation taps in order to avoid these types of problems, see our sniffing tutorial for more details). The analysis provided here is therefore based on the other five pcap files provided by Contagio.

Here is a timeline with relative timestamps (the frame timestamps in the provided PCAP files were way of anyway, we noticed an offset of over 2 months!):

  • 0 seconds : Victim boots up and requests an IP via DHCP
  • 5 seconds : Victim perform a DNS query for time.windows.com
  • 6 seconds : Victim gets time via NTP
    ---{malware most likely gets executed here somewhere}---
  • 22 seconds : Victim performs DNS query for checkip.dyndns.org
  • 22 seconds : Victim gets its external IP via an HTTP GET request to checkip.dyndns.org
  • 23 seconds : Victim connects to the Tor network, typically on port TCP 9001 or 443
    ---{lots of Tor traffic from here on}---

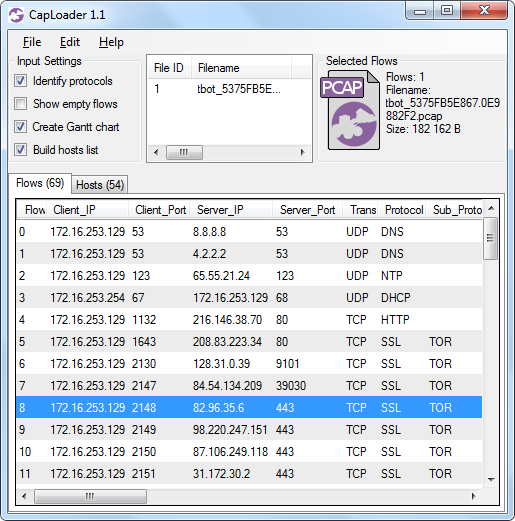
This is what it looks like when one of the tbot pcap files has been loaded into CapLoader with the “Identify protocols” feature activated:
CapLoader detecting Tor protocol
CapLoader with protocol detection in action - see “TOR” in the “Sub_Protocol” column

Notice how the flows to TCP ports 80, 9101 and 443 are classified as Tor? The statistical method for protocol detection in CapLoader is so effective that CapLoader actually ignores port numbers altogether when identifying the protocol. The speed with which CapLoader parses PCAP files also enables analysis of very large capture files. A simple way to detect Tor traffic in large volumes of network traffic is therefore to load a capture file into CapLoader (with “Identify protocols” activated), sort the flows on the “Sub_Protocol” column, and scroll down to the flows classified as Tor protocol.


Beware of more Tor backdoors

Most companies and organizations allow traffic on TCP 443 to pass through their firewalls without content inspection. The privacy provided by Tor additionally makes it easy for a botnet herder to control infected machines without risking his identity to be revealed. These two factors make Tor a perfect fit for hackers and online criminals who need to control infected machines remotely.

Here is what Claudio Guarnieri says about the future use of Tor for botnets in his Rapid7 blog post:

“The most important factor is certainly the adoption of Tor as the main communication channel and the use of Hidden Services for protecting the backend infrastructure. While it’s surprising that not more botnets adopt the same design, we can likely expect more to follow the lead in the future.”

Incident responders will therefore need to learn how to detect Tor traffic in their networks, not just in order to deal with insiders or rogue users, but also in order to counter malware using it as part of their command-and-control infrastructure. However, as I've shown in this blog post, telling Tor apart from normal SSL traffic is difficult. But making use of statistical protocol detection, such as the Port Independent Protocol Identification (PIPI) feature provided with CapLoader, is in fact an effective method to detect Tor traffic in your networks.

Posted by Erik Hjelmvik on Saturday, 06 April 2013 20:55:00 (UTC/GMT)

Tags: #CapLoader#TOR#Protocol Identification#SSL#TLS#HTTPS#PCAP#PIPI

Share: Facebook   Twitter   Reddit   Hacker News Short URL: https://netresec.com/?b=13400BE


Extracting Metadata from PcapNG files

Photo by Meighan O'Toole

In our blog post about the Chinese MITM of GitHub we revealed the identity of the anonymous capture file uploader by analyzing metadata available in the PCAP-NG file format. In this blog post we explain what type of meta-data that can be found in PcapNG files, and how to extract it.

The old libpcap format (a.k.a. PCAP) is designed to only store captured network frames. The new PCAP-NG format, however, additionally includes the ability to store meta-data in the capture files. In fact only about 20% of the PcapNG file specification concerns storage of captured frames, the remaining 80% is focused on various types of metadata.

So what types of metadata can a PcapNG file contain? Well, the spec allows features such as MAC address of capturing interface as well as interface speed (in bps) to be stored. But the most commonly used metadata types are:

  • Operating system of the sniffer machine
  • Software used to create the capture file (application name and version)
  • Name of interface from where packets are captured
  • Description of interface from where packets are captured
  • Capture filter used when sniffing packets
  • Cached name resolution entries (mappings from IPv4 or IPv6 addresses to host names)
  • User comments on individual frames (a.k.a. “annotations”),

Extracting Metadata

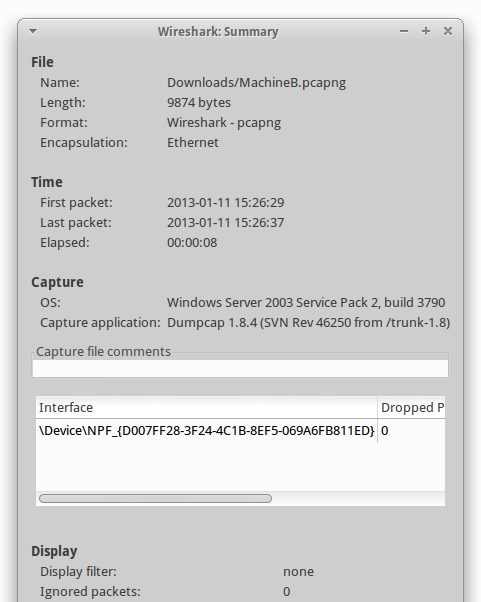
Some of these metadata types can be displayed in Wireshark by clicking “Statistics > Summary”. Here's the information provided when displaying a Summary in Wireshark on MachineB.pcapng from CloudShark:

Wireshark Summary of MachineB.pcapng

However, what is not shown in this summary view is that MachineB.pcapng additionally contains cached name resolution information for two machines.

Here's the list of metadata information extracted from MachineB.pcapng:

Type Value
shb_os Windows Server 2003 Service Pack 2, build 3790
shb_userappl Dumpcap 1.8.4 (SVN Rev 46250 from /trunk-1.8)
if_name \Device\NPF_{D007FF28-3F24-4C1B-8EF5-069A6FB811ED}
if_tresol 0x06
if_os Windows Server 2003 Service Pack 2, build 3790
nres_ip6record fe80::9a03:d8ff:fedb:904b = iPhone-von-b1.local
nres_ip4record 192.168.13.124 = iPhone-von-b1.local
nres_ip6record fe80::8685:6ff:fe23:c95d = iPhone-von-Gurkan.local
nres_ip4record 192.168.13.188 = iPhone-von-Gurkan.local

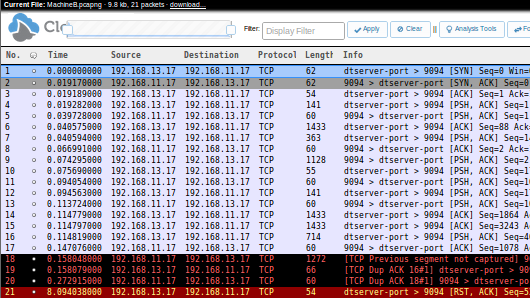
The metadata apparently contains name resolution info for two iPhones, and we've got their internal IPv4 as well as IPv6 addresses. This would normally imply that the capture file contains frames to or from these IP addresses. However, as shown in the following screenshot from CloudShark, the capture file contains 21 frames but not a single one of them is from or to “iPhone-von-Gurkan” or “iPhone-von-b1”:

CloudShark's view of MachineB.pcapng

Thus, it seems as if the Wireshark pcap-ng host name disclosure bug wasn't fixed in Wireshark 1.8.4 after all.

Megecap Leaks File Paths

It is, however, not only Wireshark that might leak private information in PcapNG metadata. The command line tool Mergecap additionally stores the complete path and filename of the individual capture files that have been combined with the tool.

Type Value
opt_comment File created by merging: File1: /home/erik/captures/customer_X/capture_tap0_p5p1.cap File2: /home/erik/captures/customer_X/capture_tap1_p1p1.cap
shb_userappl mergecap
if_tresol 0x06

Metadata available in PcapNG file created with mergecap

This is most likely not a bug, but rather information leakage by design, so don't expect this to be mitigated in a future Mergecap release.

Conclusions

As we pointed out in our blog post “HowTo handle PcapNG files”, the best way to avoid information leakage via PcapNG files is to stay with the good ol' PCAP format by using the “-P” switch like this:

dumpcap -P -i eth0 -w dump.pcap

Posted by Erik Hjelmvik on Thursday, 14 February 2013 19:25:00 (UTC/GMT)

Tags: #PcapNG#pcap-ng#PCAP#Extract

Share: Facebook   Twitter   Reddit   Hacker News Short URL: https://netresec.com/?b=132A297


Forensics of Chinese MITM on GitHub

Great Wall of China by beggs

On January 26 several users in China reported  SSL  problems while connecting to the software development site GitHub.com. The reports indicated that the Great Firewall of China (GFW) was used to perform a Man-in-the-Middle (MITM) attack against users in China who were visiting GitHub. This attack was most likely conducted in order to track which users that were reading or contributing to the list of persons behind the GFW, which is hosted on GitHub.

There is a good writetup on the attack by GreatFire.org, which says:

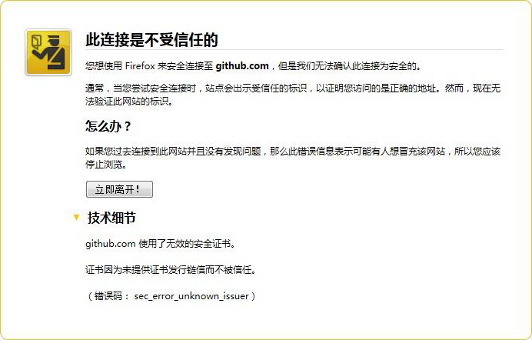
”At around 8pm, on January 26, reports appeared on Weibo and Twitter that users in China trying to access GitHub.com were getting warning messages about invalid SSL certificates. The evidence, listed further down in this post, indicates that this was caused by a man-in-the-middle attack.
[...]
It was very crude, in that the fake certificate was signed by an unknown authority and bound to be detected quickly. The attack stopped after about an hour.”

SSL error at github.com by bitinn
Screenshot of SSL error at github.com by @bitinn

An important part of evidence, which was used  in  the  coverage of this incident, was a packet capture file named github.pcapng that was anonymously uploaded to CloudShark.

A self-signed X.509 certificate file, named github.com.crt, was also used as evidence. It is, however, easy to extract X.509 certificates from PCAP files, so the github.com.crt file might come from the github.pcapng capture file at CloudShark.

We have no reason not to trust the reports coming from users in China, who have been victims of this MITM attack. However, in the spirit of “Trust, but verify” I decided to perform some network forensic analysis on the capture file. More specifically I set out to answer the following questions:

Q1 : Is the user a victim of a real attack rather than having staged and recorded a MITM attack set up by himself?
Q2 : Is the user located in China?
Q3 : What can we say about the technology being used for the MITM?

Time-to-Live Analysis

My first step was to load the PcapNG file from CloudShark in CapLoader:

File > Open URL > Enter:
http://www.cloudshark.org/captures/cbdd11b20a5c/download

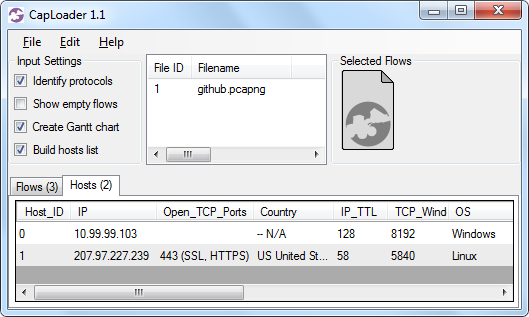
CapLoader with github.pcapng loaded

The “Hosts” tab shows that the capture file only contained traffic between two network hosts; the user's machine and the GitHub server. I also noticed that the GitHub server (207.97.227.239) had an IP TTL of 58 and TCP Window Size of 5840. This values are a typical indication of the host being a Linux machine (see our passive OS fingerprinting blog post for more details). However, when connecting to GitHub.com from here (Sweden) the same server has an IP TTL of 128 and Window Size 64240. This looks more like a Windows machine, and is significantly different from what the Chinese user got.

It can also be noted that a TTL of 58, which the Chinese user got, would mean that the SSL connection was terminated just six router hops away from the user. However, a traceroute from ihep.ac.cn (in Beijing, China) to github.com requires a whopping 16 hops. Additionally, this traceroute hasn't even left Beijing after six hops.

traceroute to 207.97.227.239 (207.97.227.239), 30 hops max, 38 byte packets
1 gw (202.38.128.2) 0.231 ms 0.175 ms 0.178 ms
2 202.122.36.1 (202.122.36.1) 0.719 ms 0.626 ms 0.652 ms
3 192.168.1.25 (192.168.1.25) 0.509 ms 0.485 ms 0.459 ms
4 8.131 (159.226.253.77) 0.516 ms 0.488 ms 0.496 ms
5 8.198 (159.226.253.54) 11.981 ms 0.913 ms 0.829 ms
6 8.192 (159.226.254.254) 40.477 ms 40.614 ms 40.524 ms
7 Gi6-0.gw2.hkg3.asianetcom.net (203.192.137.173) 53.062 ms 40.610 ms 40.617 ms
8 te0-3-0-0.wr1.hkg0.asianetcom.net (61.14.157.249) 42.459 ms 43.133 ms 43.765 ms
9 te0-1-0-0.wr1.osa0.asianetcom.net (61.14.157.58) 76.603 ms 76.586 ms 76.648 ms
10 gi6-0-0.gw1.sjc1.asianetcom.net (61.14.157.98) 195.939 ms 195.934 ms 196.090 ms
11 ip-202-147-50-250.asianetcom.net (202.147.50.250) 180.966 ms 181.058 ms 181.339 ms
12 dcx2-edge-01.inet.qwest.net (67.14.28.70) 342.431 ms 340.882 ms 338.639 ms
13 67.133.246.158 (67.133.246.158) 253.975 ms 253.407 ms 253.742 ms
14 vlan905.core5.iad2.rackspace.net (72.4.122.10) 253.468 ms 252.947 ms 253.639 ms
15 aggr301a-1-core5.iad2.rackspace.net (72.4.122.121) 253.767 ms 253.862 ms 253.010 ms
16 github.com (207.97.227.239) 254.104 ms 253.789 ms 253.638 ms

MAC Address

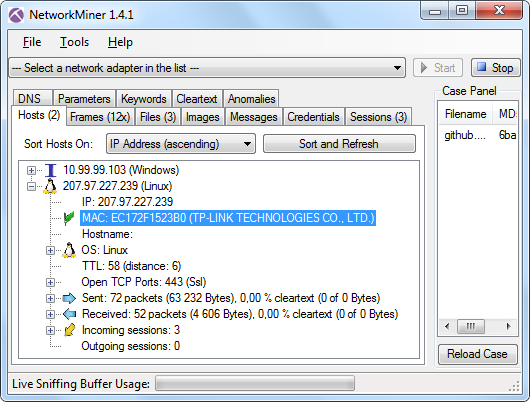
NetworkMiner with PCAP file from GitHub MITM loaded

As shown in the NetworkMiner screenshot above, the Ethernet MAC address of the client's default gateway is ec:17:2f:15:23:b0, which indicates that the user's router was a device from TP-LINK. TP-LINK is a large provider of networking devices who make more than half of their sales within China. This supports the theory that the user was located in China.

PcapNG Metadata

As we've mentioned in a previous blog post, PcapNG files can contain a great deal of metadata. I therefore wrote a simple parser to extract all the juicy metadata that was available in the github.pcapng file that was anonymously uploaded to CloudShark. The metadata revealed that the user was running “64-bit Windows 7 Service Pack 1, build 7601” and sniffing with “Dumpcap 1.8.2 (SVN Rev 44520 from /trunk-1.8)”, which normally means that Wireshark 1.8.2 was being used (since it uses dumpcap for all packet capturing tasks).

The PcapNG file additionally contained a great deal of Name Resolution Blocks, i.e. cached DNS entries. Among these entries was an entry that mapped the IP 10.99.99.102 to the hostname “SHAOJU-IPAD.local”. So why was there a name resolution entry for an IP address that wasn't part of the capture file? Well, cached name resolution entries aren't properly cleaned from PcapNG files written with Wireshark 1.8.0 to 1.8.3 due to a vulnerability discovered by Laura Chappell.

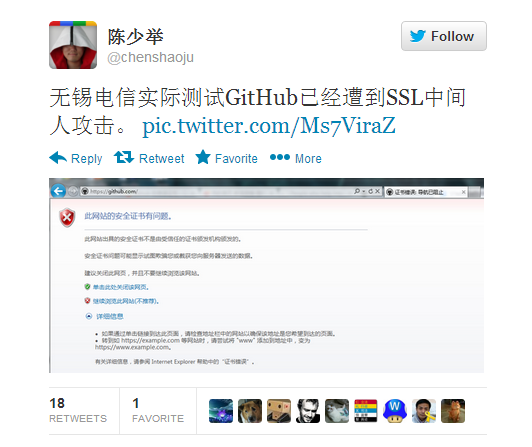
So, who is “Shaoju”? Well, a Google query for shaoju github will bring you to the GitHub user Chen Shaoju, who also tweeted a screenshot of the SSL error he received when accessing GitHub.com.

SSL error received by Chen Shaoju when accessing GitHub.com

Conclusions

Q1 : Is the user a victim of a real attack rather than having staged and recorded a MITM attack set up by himself?
A1 : Yes, this is most likely a REAL attack. I'd find it unlikely that a user trying to fake such a MITM attack would use an environment with six router hops between the client and MITM machine.
Q2 : Is the user located in China?
A2 : Yes, I'm convinced that the PcapNG file was sniffed by Chen Shaoju, who lives in Wuxi, China according to his GitHub profile.
Q3 : What can we say about the technology being used for the MITM?
A3 : The fact that the MITM machine was six hops away from the user indicates that the MITM is taking place at some fairly central position in China's internet infrastructure, as opposed to being done locally at the ISP. Additionally, the machine doing the MITM seems to be running Linux and having an initial IP TTL of 64 and a TCP Window Size of 5840.


UPDATE (February 5) : Privacy / Anonymity

The fact that this blog post reveals the identity of the anonymous github.pcapng uploader seems to have caused some  reactions online.

I did, however, contact Chen Shaoju before publishing this blog post. In fact, I even sent him an email as soon as we discovered that it was possible to identify him through the capture file's metadata. Here's what I wrote:

“I'm working on a blog post about the GitHub pcap file on CloudShark. My analysis indicates that you sniffed the traffic. Is it OK with you if I publish this blog post?

If not, then I'd recommend that you remove the pcap file from couldshark in order to prevent others from identifying you via your pcap file.”
Shaoju responded the same day and said it was OK.

Once the text for the blog post was finished I also sent him a copy for verification before we published it online. Again, Shaoju responded swiftly and said that it looked good.

Also, I'm sure that Shaoju (@chenshaoju) can confirm that this blog post was published with his consent.

Finally, I'd like to add a few recommendations to users who wish to preserve their anonymity when sharing capture files:

  1. Filter out any traffic that isn't relevant to what you wish to share. CapLoader is a handy tool for selecting and filtering capture files based on flows or IP addresses.
  2. Save the capture file in the old libpcap (PCAP) format. This will remove the metadata available in Pcap-NG option fields.
  3. Anonymize frame headers, i.e Ethernet MAC addresses or even IP addresses (if needed), with a tool like: tcprewrite, Bit-Twist or TraceWrangler.

Posted by Erik Hjelmvik on Saturday, 02 February 2013 22:10:00 (UTC/GMT)

Tags: #GitHub#PcapNG#China#GFW#Forensics#MITM#SSL

Share: Facebook   Twitter   Reddit   Hacker News Short URL: https://netresec.com/?b=1328C6B


Analyzing 85 GB of PCAP in 2 hours

Hadoop photo by Robert Scoble

Lets say you've collected around 100 GB of PCAP files in a network monitoring installation. How would you approach the task of looking at the application layer data of a few of the captured sessions or flows?

For much smaller datasets, in the order of 100 MB, one would typically load the PCAP into Wireshark and perform ”Follow TCP Stream” on a few sessions to see what's going on. But loading gigabyte datasets into Wireshark doesn't scale very well, in fact Wireshark will typically run out of RAM and crash saying “Out Of Memory!” or just “Wireshark has stopped working”. Ulf Lamping explains why on the Wireshark Wiki:

“Wireshark uses memory to store packet meta data (e.g. conversation and fragmentation related data) and to display this info on the screen.
[...]
I need memory about ten times the actual capture file size”

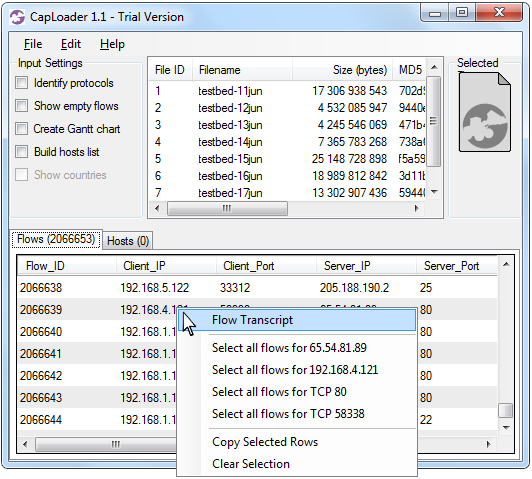
The solution I'm proposing is to instead download the free version of CapLoader, load the PCAP files into CapLoader and perform ”Flow Transcript” on a few of the flows. So how long time would it take to do this on 100 GB of PCAP files? I did a quick test and loaded the 85 GB dataset from ISCX 2012 into CapLoader on an ordinary laptop computer. After just 1 hour 47 minutes all of the PCAP files from ISCX 2012 were loaded and indexed by CapLoader! Also, please note that datasets this large can be parsed in less than 30 minutes with a more powerful PC.

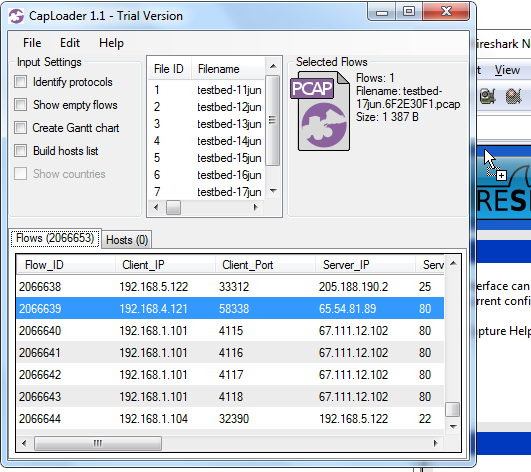
After having loaded all the PCAP files CapLoader presents a list of all the 2.066.653 indexed flows from the ISCX 2012 dataset. Right-clicking a UDP or TCP flow brings up a context menu that allows you to generate a “Flow Transcript”, this feature is basically the same thing as Wireshark's “Follow TCP Stream”.

Right-click a flow in CapLoader
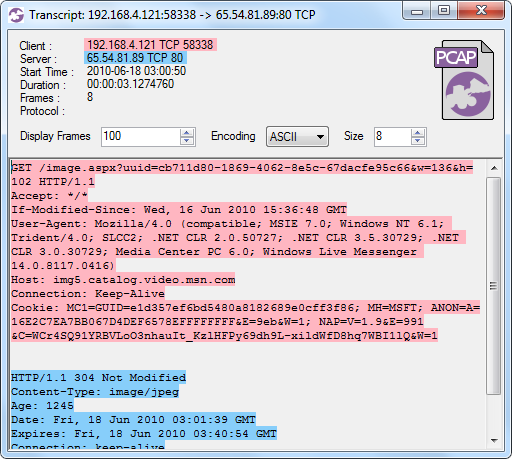
CapLoader Flow Transcript
CapLoader's Flow Transcript View

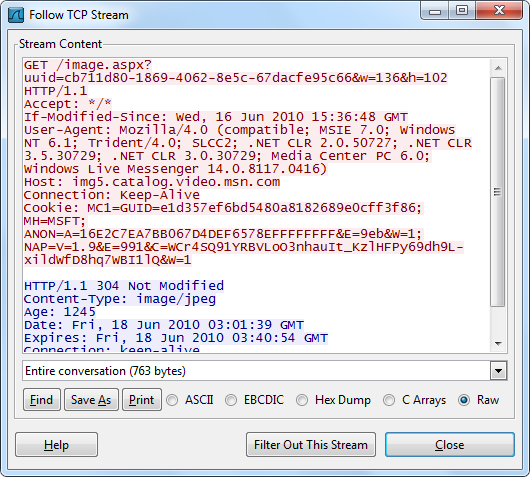
You can, of course, always extract the frames from any flow directly to Wireshark if you aren't ready to abandon Wireshark's Follow TCP Stream just yet. A flow is extracted simply by selecting a flow in the list and then doing drag-and-drop from CapLoader's PCAP icon (at the top right) onto Wireshark.

Drag-and-Drop from CapLoader to Wireshark
Wireshark follow TCP stream

The fact that CapLoader parses and indexes large PCAP files very fast and that the analyst is provided with powerful tools, like the Transcript feature, to look at the raw packet data makes it possible to perform big-data network traffic analysis using an ordinary PC. This means that you do NOT need to upload your network traffic to the Cloud, or build a 100-machine cluster, in order to let a Hadoop instance parse though your multi-gigabyte packet captures. All you need is an ordinary PC and a copy of CapLoader.

For more information about CapLoader please have a look at our blog post highliting the new features in version 1.1 of CapLoader or browse through all our blog posts about CapLoader.

This blog post makes use of the UNB ISCX 2012 Intrusion Detection Evaluation Dataset, which is created by Ali Shiravi, Hadi Shiravi, and Mahbod Tavallaee from University of New Brunswick


UPDATE 2016-05-23

With the release of CapLoader 1.4 it is now possible to perform flow transcripts not only from the Flows tab, but also from the Services and Hosts tab. In these cases the transcript will be that of the first flow of the selected service or host.

Posted by Erik Hjelmvik on Thursday, 24 January 2013 12:20:00 (UTC/GMT)

Tags: #CapLoader#PCAP#gigabyte#GB#Wireshark#Follow TCP Stream#transcript#Big Data

Share: Facebook   Twitter   Reddit   Hacker News Short URL: https://netresec.com/?b=13135F8

2013 January

CapLoader 1.1 Released

X / twitter

NETRESEC on X / Twitter: @netresec

Mastodon

NETRESEC on Mastodon: @netresec@infosec.exchange