Maximizing IOC Impact
I’ve been thinking about threat intelligence lately. Specifically: indicators of compromise (IOC), how and where to share them to cause maximum pain to adversaries and help as many organizations as possible protect themselves.
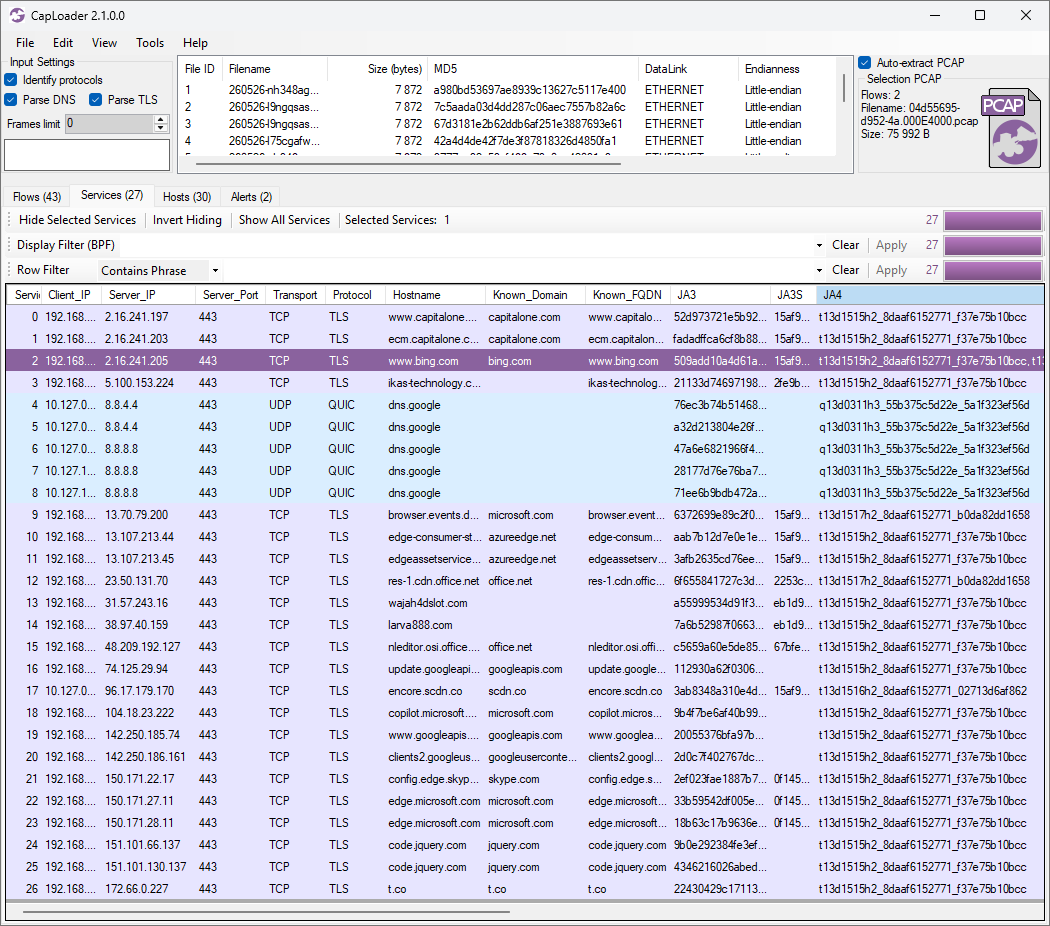
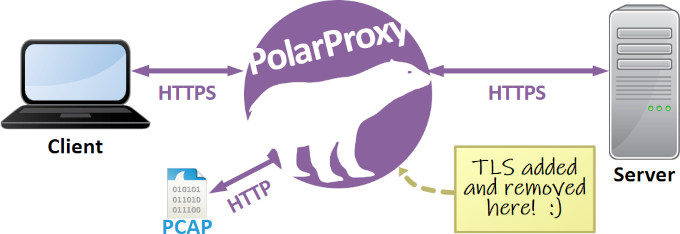
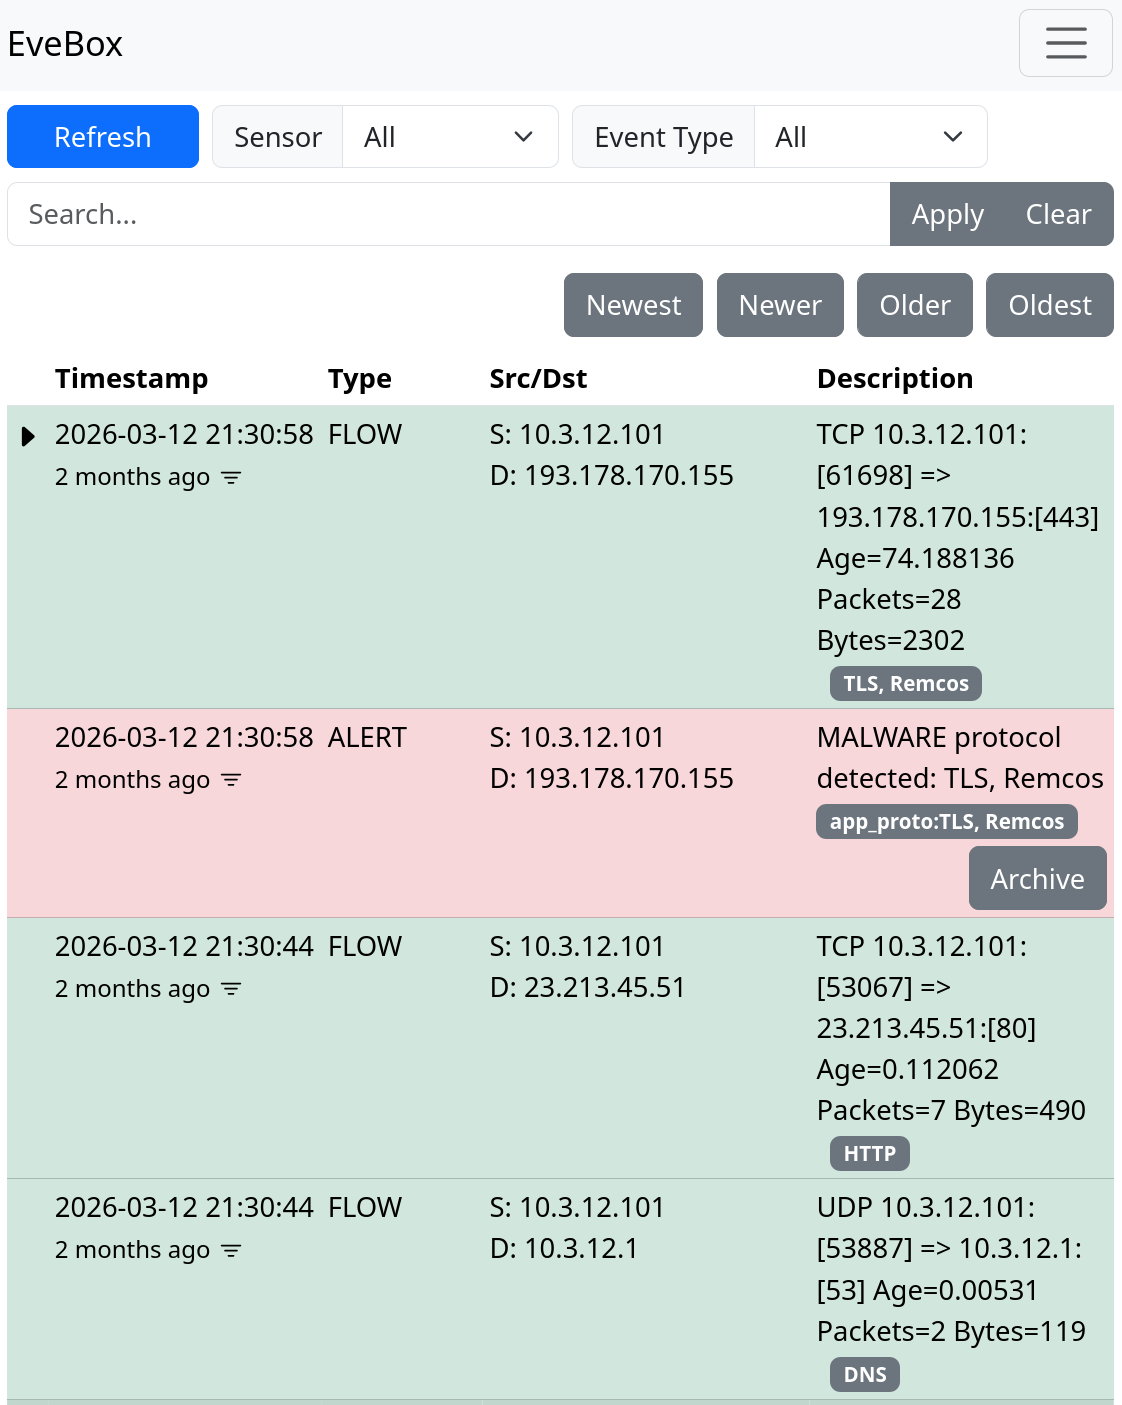
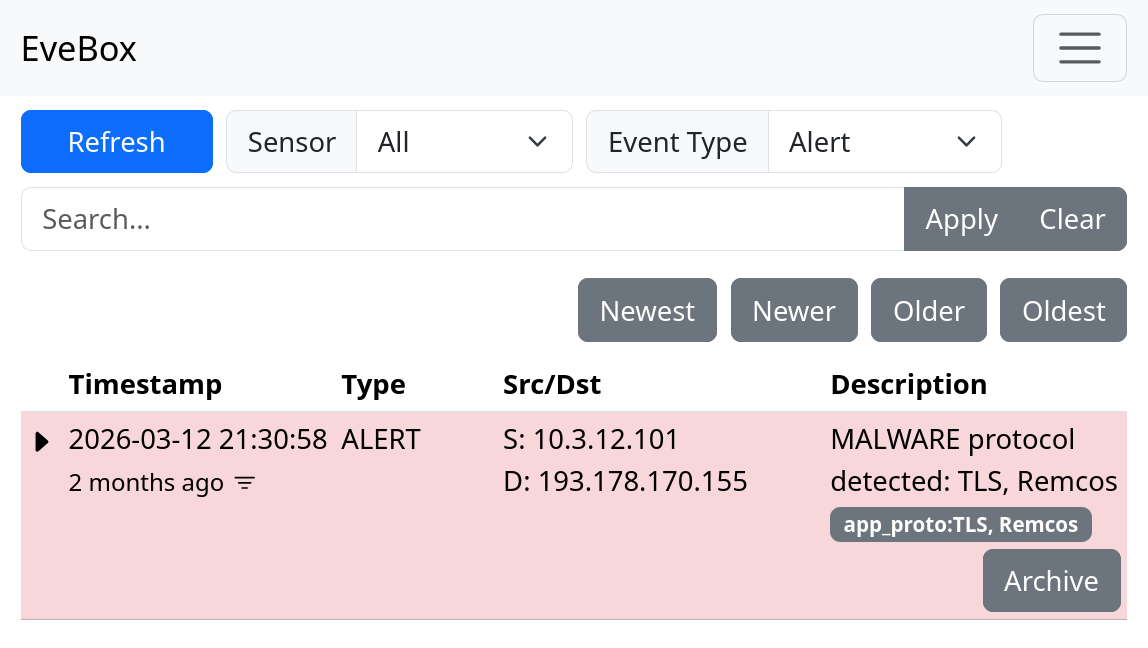
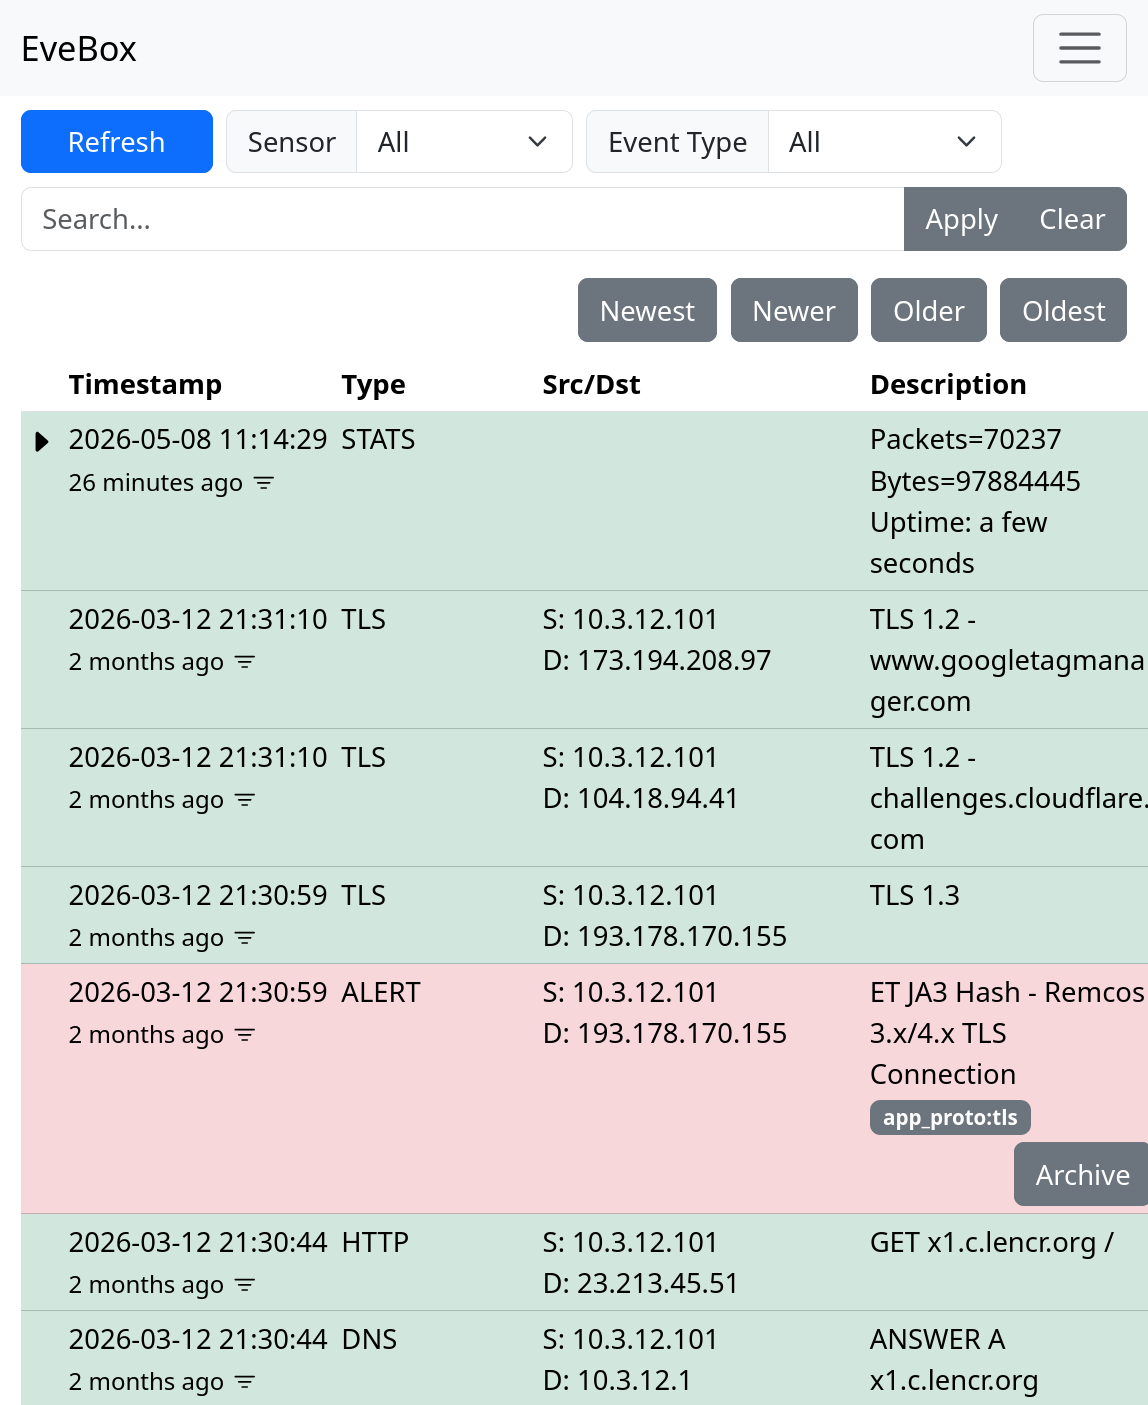
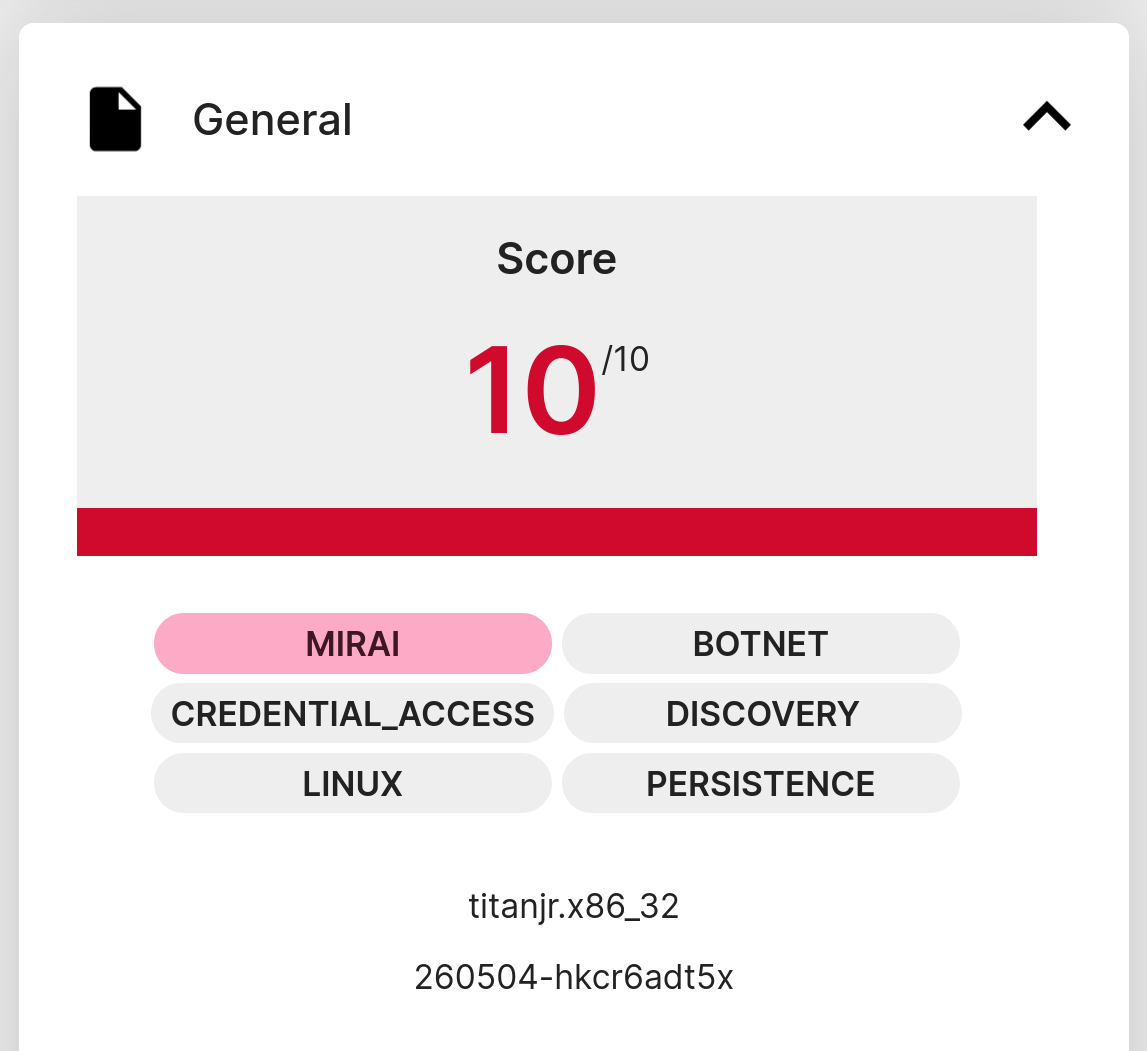
I regularly analyze malware traffic from sandboxes such as ANY.RUN, Triage, JoeSandbox and Hybrid Analysis. Pulling fresh PCAPs is an easy way to find malware command-and-control (C2) traffic to previously unknown C2 servers. This method can even reveal new and unreported C2 protocols. I often use CapLoader and NetworkMiner to extract network IOCs, such as:
- Domain names
- IP:port
- URIs
- JA3 / JA3S hashes
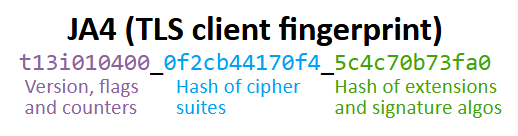
- JA4 fingerprints
- X.509 certificate thumbprints
- packet pattern/signature
These indicators can be found in the lower sections of David J. Bianco’s pyramid of pain. But that doesn’t mean they’re not worth sharing — they’re easy to detect, have low false-positive rates, and are very actionable. Their main drawback is short lifetime, so rapid and wide IOC distribution matters.

Image: ASCII pyramid from Optimizing IOC Retention Time
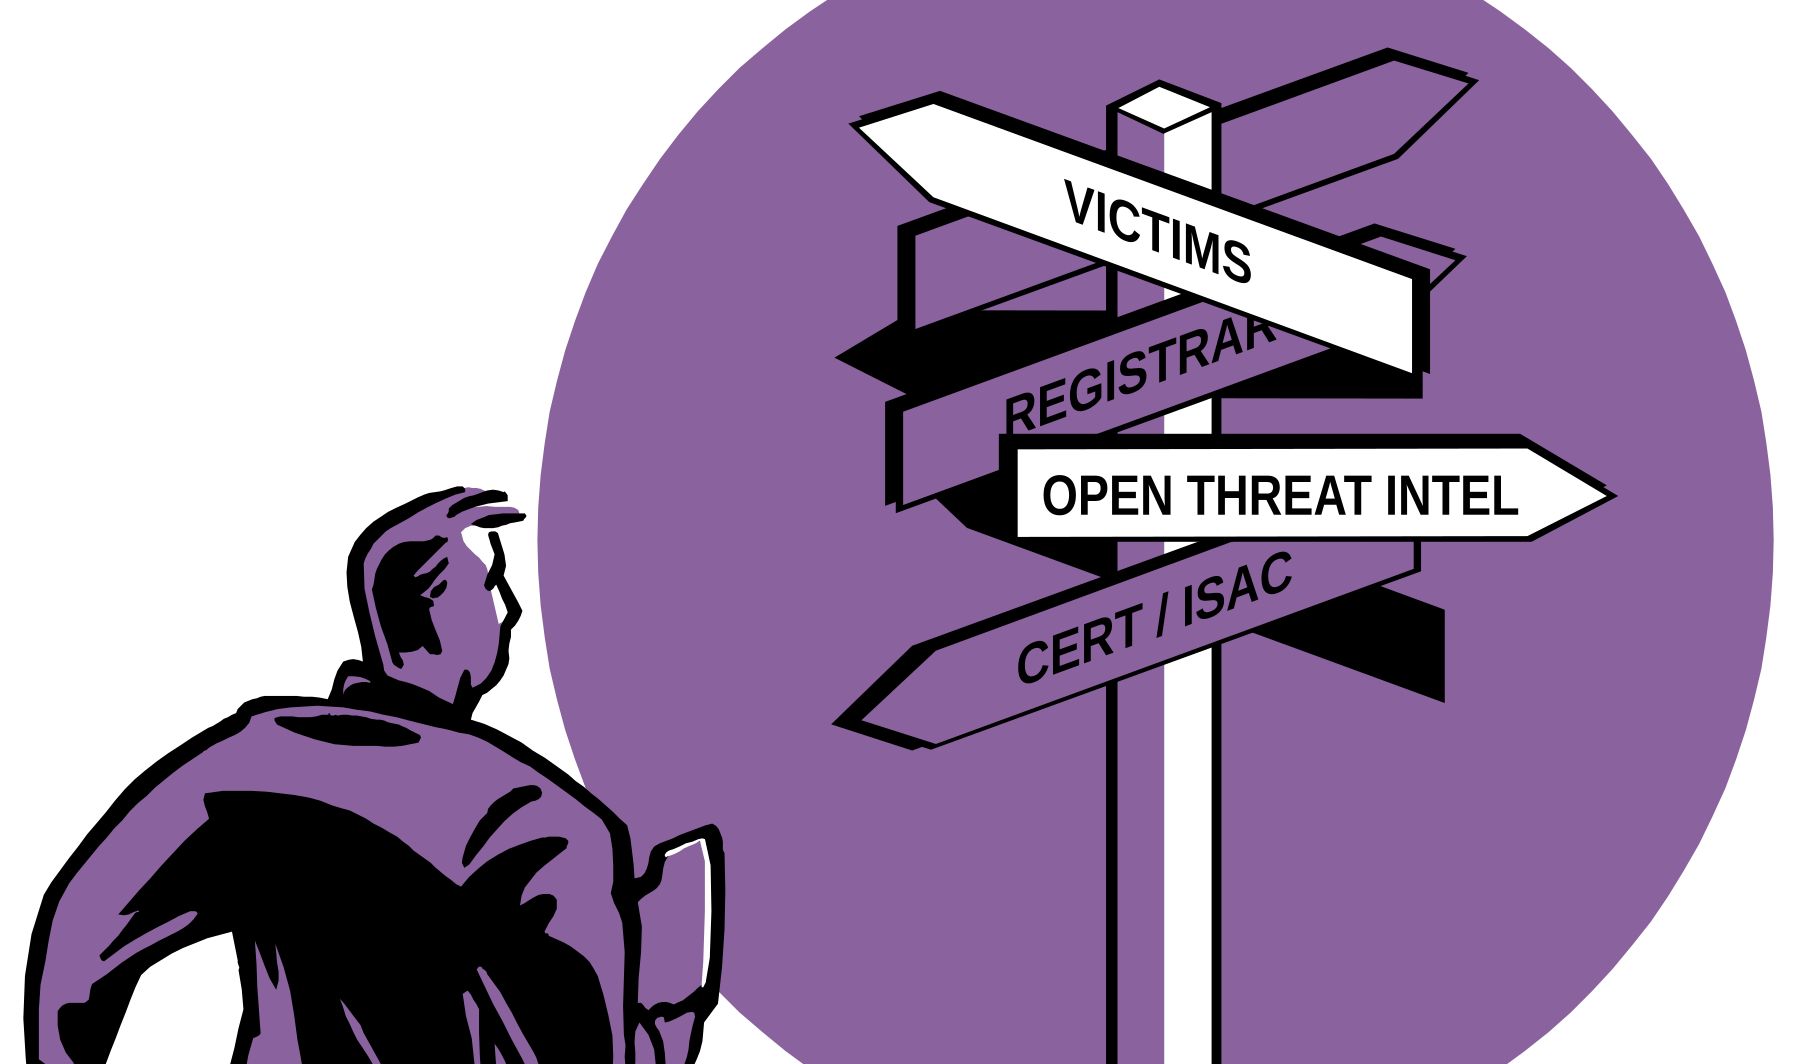
False positives are a real concern, so manual verification of an IOC is required before sharing. Many IOCs are already reported to threat-intel sharing platforms, like ThreatFox, OTX or one of the many MISP instances out there, but I frequently find ones that aren’t. When I discover an IOC, I typically consider these options:
- Report directly to the hosting provider, registrar or network owner.
- Share with a national or sector CERT.
- Share with an ISAC.
- Publish to threat-sharing platforms (ThreatFox/URLhaus/OTX/MISP/AbuseIPDB/etc).
- Publish in a blog post or on social media.
I generally pick outlets case-by-case. Sometimes by convenience, sometimes by where I expect to achieve the greatest impact. Is there a single best destination? Often not, it depends.
Sending an IOC to every channel is comprehensive, but time-consuming. Ideally, a verified IOC drop point that automatically propagates to all the right places would be fantastic! But as far as I know, no such service exists.
I mostly look at malware that hit many victims, which is why it makes sense to prioritize fast, broad distribution (free threat-intel services and blog/social posts). But I have also investigated APT attacks and state-sponsored campaigns, such as Man-on-the-Side attacks, SSL MITM attacks in China as well as DNS traffic from Cozy Bear’s SolarWinds hack. The right place to share IOCs for APT attacks is often different than for mainstream malware. For targeted or sensitive operations, I recommend reaching out to victims, CERTs or a trusted intermediary.
Factors affecting the choice of IOC sharing method:
- Scope and scale of impact: Mass-distribution malware should be blocked widely. Notify specific victims or CERTs on targeted attacks.
- Lifetime and volatility: Short-lived IOCs (IPs, domains) benefit from fast, broad distribution. Longer-lived indicators are better shared in reports or blog posts that provide more depth and context.
- False-positive risk: Prefer channels that support easy updates/removals and allow others to validate or comment.
- Remediation: If a takedown or abuse report is appropriate, contact providers or registrars directly.
- Victimology: Choose platforms aligned with who needs to act. ISACs/CERTs for sectors, targeted notifications for known victims, open feeds for broad coverage.
Many companies and organizations engage in mutual sharing in closed trust groups, expecting that by sharing with others, they will return the favor. This creates a "win-win" situation for the trust group members, while the wider community misses out. As someone who doesn't require IOCs, I find that this approach can limit my reach. I prefer to get information out to as many people as possible, as quickly as possible, with minimum effort. I’ve also noticed a growing commercialization of threat intelligence, which is both good and bad. It can provide funding for threat-intel platforms, but may also limit reach when threat feeds and APIs get paywalled.
Workflow for IOC sharing:
- Identify a potential malicious indicator (IP/domain/JA4 etc).
- Pivot on the indicator to verify maliciousness and check for false positives.
- If uncertain, ask in a trust-group, forum or request input on social media.
- Check existing public feeds and databases for the IOC.
- Assess urgency, impact, and victimology.
- If new and high-impact: submit to one or several open sharing platforms.
- If you have additional context: share it in a blog post or social notice.
- If targeted or sensitive: notify the appropriate CERT or affected organizations privately.
- If abuse/takedown is feasible: report to provider/registrar or request assistance from a national CERT.
I’m interested in hearing how others approach this. What works for you, and how do you maximize IOC sharing with minimal effort? Reach out via social media, email or share your thoughts in a writeup or blog post. Also, if you run an automated IOC propagation service, please reach out!
Posted by Erik Hjelmvik on Monday, 08 June 2026 07:00:00 (UTC/GMT)