NETRESEC Network Security Blog - Tag : Wireshark

rss Google News

What is PCAP over IP?

PCAP over IP

PCAP-over-IP is a method for reading a PCAP stream, which contains captured network traffic, through a TCP socket instead of reading the packets from a PCAP file.

A simple way to create a PCAP-over-IP server is to simply read a PCAP file into a netcat listener, like this:

nc -l 57012 < sniffed.pcap

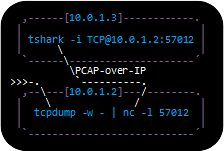
The packets in “sniffed.pcap” can then be read remotely using PCAP-over-IP, for example with tshark like this (replace 192.168.1.2 with the IP of the netcat listener):

nc 192.168.1.2 57012 | tshark -r -

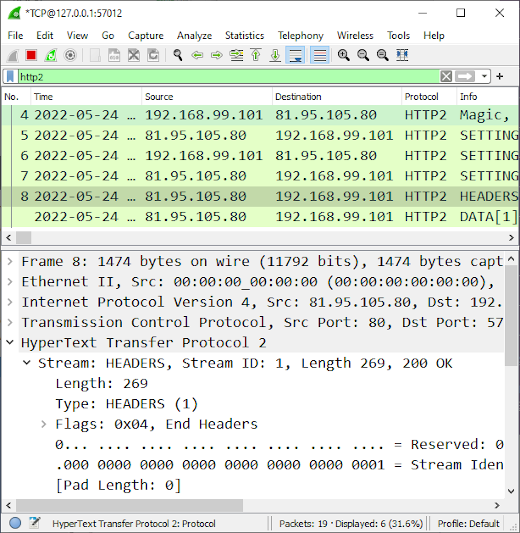
But there’s an even simpler way to read PCAP-over-IP with Wireshark and tshark, which doesn’t require netcat.

wireshark -k -i TCP@192.168.1.2:57012
tshark -i TCP@192.168.1.2:57012

The Wireshark name for this input method is “TCP socket” pipe interface, which is available in Linux, Windows and macOS builds of Wireshark as well as tshark.

PCAP-over-IP in Wireshark's Pipe Interfaces

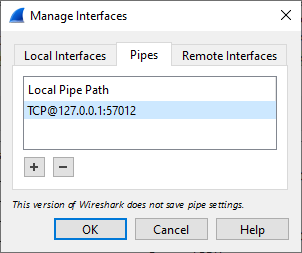
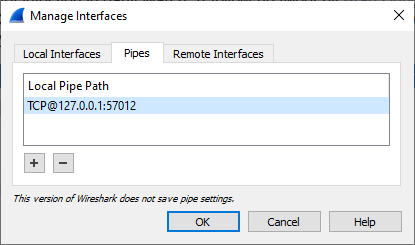
It is also possible to add a PCAP-over-IP interface from Wireshark's GUI. Open Capture/Options, Manage Interfaces, Pipes Tab and then enter a Local Pipe Path such as TCP@127.0.0.1:57012 and click OK. This setting will disappear when you close Wireshark though, since pipe settings don't get saved.

Live Remote Sniffing

Sniffed traffic can be read remotely over PCAP-over-IP in real-time simply by forwarding a PCAP stream with captured packets to netcat like this:

tcpdump -U -w - not tcp port 57012 | nc -l 57012
dumpcap -P -f "not tcp port 57012" -w - | nc -l 57012
PCAP-over-IP with tcpdump, netcat and tshark

Tcpdump is not available for Windows, but dumpcap is since it is included with Wireshark.

Note how TCP port 57012 is purposely filtered out using BPF when capturing in order to avoid a snowball effect, where the PCAP-over-IP traffic otherwise gets sniffed and re-transmitted through the PCAP-over-IP stream, which again gets sniffed etc.

A more sophisticated setup would be to let the service listening on TCP port 57012 spawn the sniffer process, like this:

nc.traditional -l -p 57012 -c "tcpdump -U -w - not port 57012"

Or even better, let the listening service reuse port 57012 to allow multiple incoming PCAP-over-IP connections.

socat TCP-LISTEN:57012,reuseaddr,fork EXEC:"tcpdump -U -w - not port 57012"

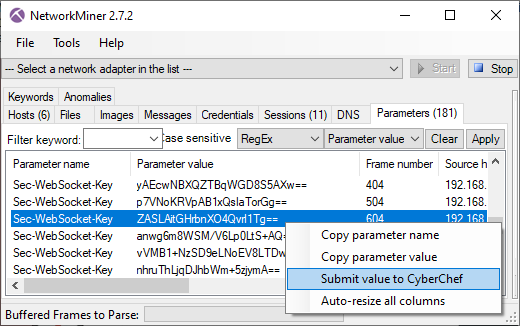
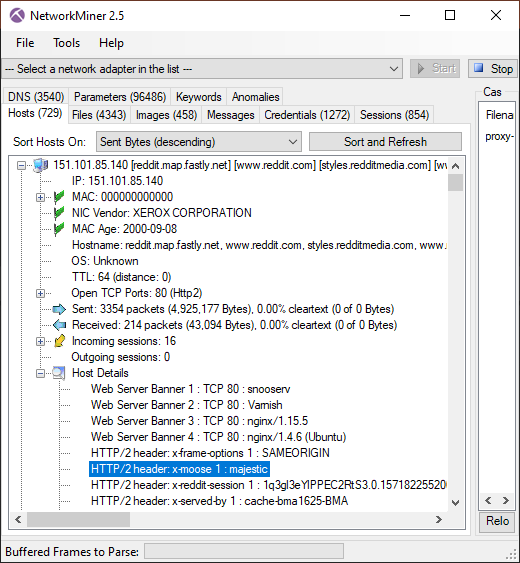
Reading PCAP-over-IP with NetworkMiner

We added PCAP-over-IP support to NetworkMiner in 2011 as part of NetworkMiner 1.1, which was actually one year before the TCP socket sniffing feature was included in Wireshark.

Live remote sniffing with NetworkMiner 2.7.3 using PCAP-over-IP

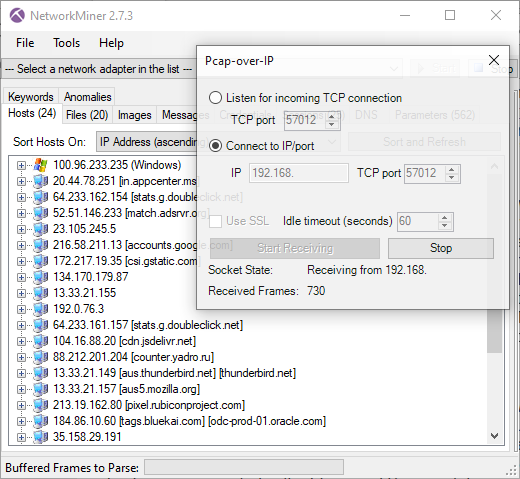
Image: Live remote sniffing with NetworkMiner 2.7.3 using PCAP-over-IP

NetworkMiner can also be configured to listen for incoming PCAP-over-IP connections, in which case the sniffer must connect to the machine running NetworkMiner like this:
tcpdump -U -w - not tcp port 57012 | nc 192.168.1.3 57012

This PCAP-over-IP feature is actually the recommended method for doing real-time analysis of live network traffic when running NetworkMiner in Linux or macOS, because NetworkMiner’s regular sniffing methods are not available on those platforms.

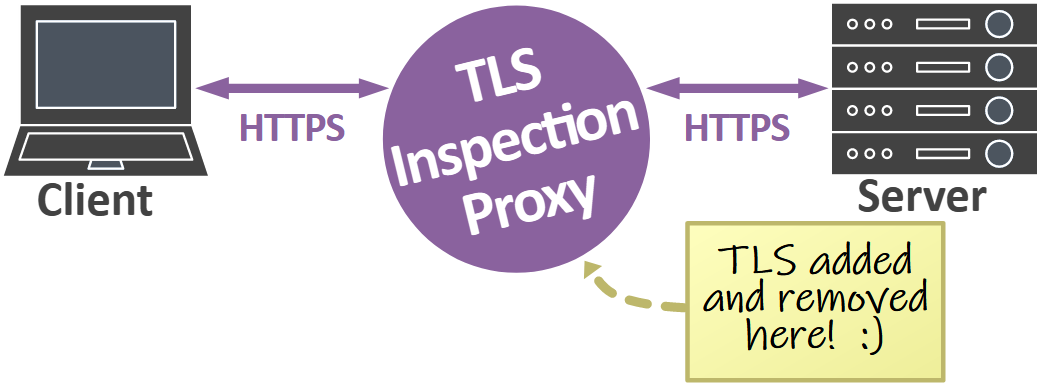
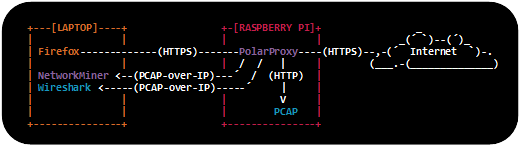
Reading Decrypted TLS Traffic from PolarProxy

PolarProxy

One of the most powerful use-cases for PCAP-over-IP is to read decrypted TLS traffic from PolarProxy. When PolarProxy is launched with the argument “--pcapoverip 57012” it starts a listener on TCP port 57012, which listens for incoming connections and pushes a real-time PCAP stream of decrypted TLS traffic to each client that connects. PolarProxy can also make active outgoing PCAP-over-IP connections to a specific IP address and port if the “--pcapoveripconnect <host>:<port>” argument is provided.

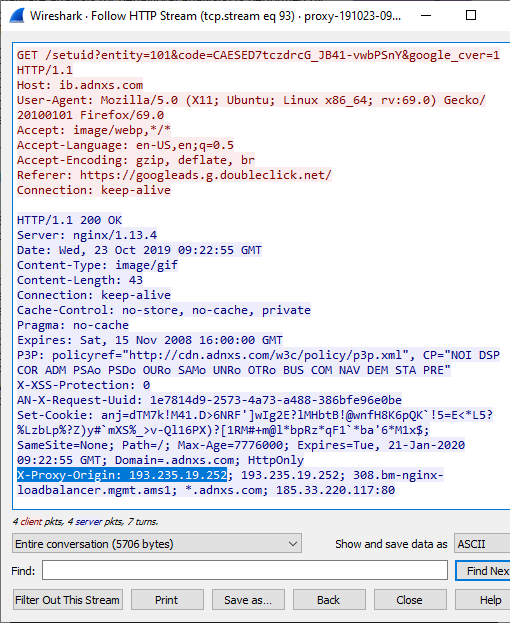
In the video PolarProxy in Windows Sandbox I demonstrate how decrypted TLS traffic can be viewed in NetworkMiner in real-time with help of PCAP-over-IP. PolarProxy’s PCAP-over-IP feature can also be used to read decrypted TLS traffic from PolarProxy with Wireshark as well as to send decrypted TLS traffic from PolarProxy to Arkime (aka Moloch).

Replaying PCAP-over-IP to an Interface

There are lots of great network monitoring products and intrusion detection systems that don’t come with a built-in PCAP-over-IP implementation, such as Suricata, Zeek, Security Onion and Packetbeat, just to mention a few. These products would greatly benefit from having access to the decrypted TLS traffic that PolarProxy can provide. Luckily we can use netcat and tcpreplay to replay packets from a PCAP-over-IP stream to a network interface like this:

nc localhost 57012 | tcpreplay -i eth0 -t -

But for permanent installations we recommend creating a dedicated dummy interface, to which the traffic gets replayed and sniffed, and then deploy a systemd service that performs the replay operation. See our blog post Sniffing Decrypted TLS Traffic with Security Onion for an example on how to deploy such a systemd service. In that blog post we show how decrypted TLS traffic from PolarProxy can be replayed to a local interface on a Security Onion machine, which is being monitored by Suricata and Zeek.

Nils Hanke has also compiled a detailed documentation on how decrypted TLS packets from PolarProxy can be replayed to Packetbeat and Suricata with help of tcpreplay.

In these setups netcat and tcpreplay act as a generic glue between a PCAP-over-IP service and tools that can sniff packets on a network interface, but there are a few drawbacks with this approach. One drawback is that tcpreplay requires root privileges in order to replay packets to an interface. Another drawback is that extra complexity is added to the solution and two additional single point of failures are introduced (i.e. netcat and tcpreplay). Finally, replaying packets to a network interface increases the risk of packet drops. We therefore hope to see built-in PCAP-over-IP implementations in more network monitoring solutions in the future!

FAQ for PCAP-over-IP

Q: Why is it called “PCAP-over-IP” and not “PCAP-over-TCP”?

Good question, we actually don’t know since we didn’t come up with the name. But in theory it would probably be feasible to read a PCAP stream over UDP or SCTP as well.

Q: What is the standard port for PCAP-over-IP?

There is no official port registered with IANA for PCAP-over-IP, but we’ve been using TCP 57012 as the default port for PCAP-over-IP since 2011. The Wireshark implementation, on the other hand, uses TCP port 19000 as the default value.

Q: Which software comes with built-in PCAP-over-IP servers or clients?

The ones we know of are: Arkime, NetworkMiner, PolarProxy, tshark and Wireshark. There is also a PCAP-over-IP plugin for Zeek (see update below).

Q: Is there some way to encrypt the PCAP-over-IP transmissions?

Yes, we recommend encrypting PCAP-over-IP sessions with TLS when they are transmitted across a non-trusted network. NetworkMiner’s PCAP-over-IP implementation comes with a “Use SSL” checkbox, which can be used to receive “PCAP-over-TLS”. You can replace netcat with socat or ncat in order to establish a TLS encrypted connection to NetworkMiner.

Q: Is there a tool that can aggregate multiple PCAP-over-IP streams into one?

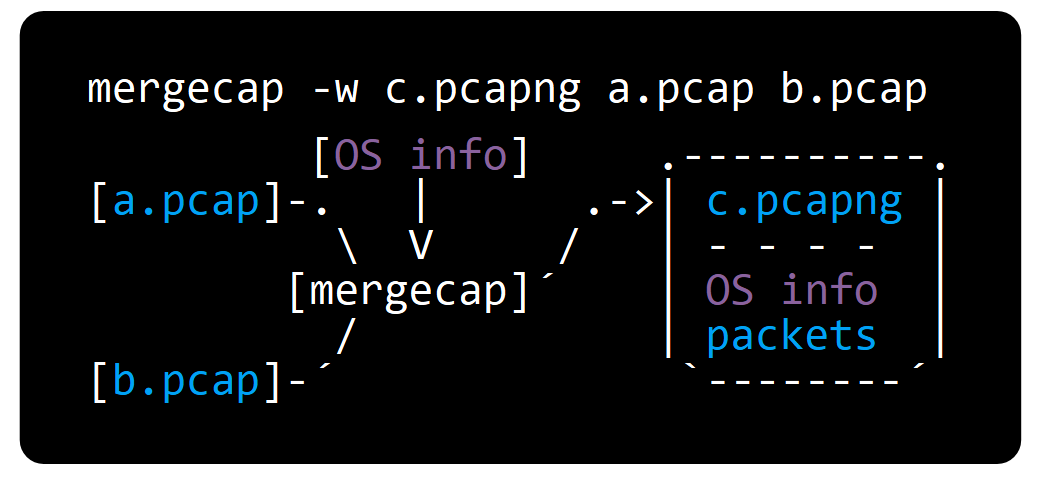
No, none that we’re aware of. However, multiple PCAP-over-IP streams can be merged into one by specifying multiple PCAP-over-IP interfaces in dumpcap and then forwarding that output to a netcat listener, like this:

dumpcap -i TCP@10.1.2.3:57012 -i TCP@10.4.5.6:57012 -w - | editcap -F pcap - - | nc -l 57012

Update 2023-04-13

Erich Nahum has published zeek-pcapovertcp-plugin, which brings native PCAP-over-IP support to Zeek.

Erich's plugin can be installed as a zeek package through zkg.

zkg install zeek-pcapovertcp-plugin

After installing the plugin, a command like this reads a PCAP stream from a remote source:

zeek -i pcapovertcp::192.168.1.2:57012

Posted by Erik Hjelmvik on Monday, 15 August 2022 08:05:00 (UTC/GMT)

Tags: #PCAP-over-IP#PCAP#tcpdump#Wireshark#tshark#NetworkMiner#PolarProxy#Suricata#Zeek#Arkime#tcpreplay#netcat#ASCII-art

Share: Facebook   Twitter   Reddit   Hacker News Short URL: https://netresec.com/?b=228fddf


Real-time PCAP-over-IP in Wireshark

Did you know that it is possible to stream captured packets from a remote device or application to Wireshark in real-time using PCAP-over-IP? This blog post explains how you can configure Wireshark to read decrypted TLS packets directly from PolarProxy over a TCP socket.

PolarProxy

PolarProxy is a TLS proxy that decrypts and re-encrypts TLS traffic, while also saving the decrypted traffic in a PCAP file. Users who wish to inspect the decrypted TLS traffic in Wireshark typically open this file from disk, but that doesn’t allow for a real-time view of the traffic.

PolarProxy comes with a feature called PCAP-over-IP, which provides a real-time PCAP stream with decrypted packets to connecting clients. If you start PolarProxy with “--pcapoverip 57012” then a PCAP-over-IP listener will be set up on TCP port 57012. I have previously demonstrated how this decrypted stream can be read by NetworkMiner, but it was not until recently that I learned that the same thing can be done with Wireshark as well.

PCAP-over-IP in Wireshark

There’s a little known feature in Wireshark that allows a PCAP stream to be read from a TCP socket, which is exactly what PCAP-over-IP is! To connect to a PolarProxy PCAP-over-IP service on the local PC, do as follows:

  1. Capture > Options (or Ctrl+K)
  2. “Manage Interfaces...”
  3. Select the “Pipes” tab
  4. Click the “+” button
  5. Name the pipe “TCP@127.0.0.1:57012” and press ENTER to save it.
    Manage Interfaces in Wireshark
  6. Click “OK” in the Manage Interface window.
  7. Click “Start” to inspect decrypted traffic from PolarProxy in real-time.

This setup works on Windows, Linux and macOS. Just remember to replace 127.0.0.1 with the IP of PolarProxy in case it is running on a remote machine.

Decrypted TLS packets from PolarProxy in Wireshark

Image: Real-time view of HTTP2 packets from decrypted TLS traffic

It’s also possible to read PCAP-over-IP with the command line tool tshark like this:

tshark -i TCP@127.0.0.1:57012

The PCAP-over-IP params can also be supplied to Wireshark on the command line in a similar manner:

wireshark -k -i TCP@127.0.0.1:57012

Happy sniffing!

Posted by Erik Hjelmvik on Tuesday, 24 May 2022 14:00:00 (UTC/GMT)

Tags: #pcapoverip#Wireshark#PolarProxy#PCAP

Share: Facebook   Twitter   Reddit   Hacker News Short URL: https://netresec.com/?b=2257d9f


Open .ETL Files with NetworkMiner and CapLoader

NetTrace.ETL in CapLoader 1.9.3 and NetworkMiner 2.7.2

Windows event tracing .etl files can now be read by NetworkMiner and CapLoader without having to first convert them to .pcap or .pcapng. The ETL support is included in NetworkMiner 2.7.2 and CapLoader 1.9.3, which were both released this morning.

What is an ETL Trace File?

ETL is short for Event Trace Log, which is ETW session data that has been logged to a file. You can, for example, extract EVTX logs from ETL files. But in this blog post we're gonna focus on network traffic that has been captured to an ETL file with a command like:

netsh trace start capture=yes report=no tracefile=packets.etl
...wait while packets are being captured...
netsh trace stop

Pro-tip: You can specify a capture NIC explicitly with "CaptureInterface=<GUID>"

NetworkMiner and CapLoader can also read packets in Pktmon ETL files, which actually are different from those created with netsh. Capturing packets to an ETL file with Pktmon is very simple:

pktmon start --capture --pkt-size 0 -f packets.etl
...wait while packets are being captured...
pktmon stop

Pro-tip: You can specify capture filters with "pktmon filter add"

You can also capture packets to ETL files with PowerShell:

New-NetEventSession -Name sniffer -LocalFilePath C:\packets.etl
Add-NetEventPacketCaptureProvider -SessionName sniffer -TruncationLength 2000
Start-NetEventSession -Name sniffer
...wait while packets are being captured...
Stop-NetEventSession -Name sniffer
Remove-NetEventSession -Name sniffer

Pro-tip: You capture packets on a remote PC by specifying a CimSession

Advantages

The built-in support for ETL files in NetworkMiner and CapLoader makes it easy to work with ETL files. Not only will you no longer need to go through the extra step of converting the ETL file to PCAP using etl2pcapng or Microsoft Message Analyzer (which was retired in 2019), the analysis will also be faster because both CapLoader and NetworkMiner read ETL files faster compared to etl2pcapng and MMA.

Limitations

The primary limitation with NetworkMiner and CapLoader's ETL support is that it only works in Windows. This means that you will not be able to open ETL files when running NetworkMiner in Linux or macOS.

Another limitation is that both NetworkMiner and CapLoader might fail to parse logged packets if the event trace was created on an OS version with an event manifest that is incompatible with the OS version on which the ETL file is opened.

Under the Hood

Both NetworkMiner and CapLoader leverage Windows specific API calls to read packets from ETL files. An ETL file opened in CapLoader first get converted to PcapNG, then CapLoader parses that PcapNG file. NetworkMiner, on the other hand, parses the packets in the ETL file directly to extract artifacts like files, images and parameters. NetworkMiner's approach is both simpler and quicker, but by converting the ETL file to PcapNG CapLoader can utilize its packet indexing feature to rapidly extract any subset of the captured traffic upon request by the user.

CapLoader's approach is also useful for users who are wondering how to open ETL files in Wireshark, since the packets from an ETL file can be opened in Wireshark by dragging the PcapNG file from the CapLoader GUI onto Wireshark.

Drag-and-drop NetTrace.pcapng from CapLoader to Wireshark
Image: NetTrace.etl converted to PcapNG in CapLoader can be drag-and-dropped onto Wireshark.

Additional Updates in NetworkMiner

The ETL support is not the only new feature in NetworkMiner 2.7.2 though. We have also added support for the ERSPAN protocol. The FTP parser has also been improved to support additional commands, such as AUTH (RFC2228).

We've also added a useful little feature to the context menu of the Parameter's tab, which allows users to send extracted parameters to CyberChef (on gchq.github.io) for decoding.

Submit Parameter value from NetworkMiner to CyberChef
Image: Right-clicking a parameter brings up a context menu with "Submit to CyberChef" option.

Additional Updates in CapLoader

The only major improvement in CapLoader 1.9.3, apart from the built-in ETL-to-PcapNG converter, is that the protocol identification speed and precision has been improved. We've also separated the identification of SSL (version 2.0 to 3.0) and TLS (SSL 3.1 and later) as two separate protocols in this version, whereas they previously both were fingerprinted as "SSL".

Credits

We'd like to thank Dick Svensson and Glenn Larsson for their input on reading ETL files. We also want to thank Markus Schewe for recommending us to add ERSPAN support to NetworkMiner!

Posted by Erik Hjelmvik on Tuesday, 02 November 2021 07:15:00 (UTC/GMT)

Tags: #PowerShell#CapLoader#NetworkMiner#PcapNG#Windows#Wireshark#PCAP#CyberChef

Share: Facebook   Twitter   Reddit   Hacker News Short URL: https://netresec.com/?b=21B0d0e


Discovered Artifacts in Decrypted HTTPS

We released a PCAP file earlier this year, which was recorded as part of a live TLS decryption demo at the CS3Sthlm conference. The demo setup used PolarProxy running on a Raspberry Pi in order to decrypt all HTTPS traffic and save it in a PCAP file as unencrypted HTTP.

Laptop, Raspberry Pi, PolarProxy, Internet ASCII

This capture file was later used as a challenge for our twitter followers, when we made the following announcement:

PCAP CHALLENGE!
The capture file released in this blog post contains a few interesting things that were captured unintentionally. Can you find anything strange, funny or unexpected in the pcap file? (1/2)

Followed by this message:

The person to submit the most interesting answer wins a “PCAP or it didn’t happen” t-shirt. Compete by including your discovery in a retweet or reply to this tweet, or in an email to info(at)netresec.com. We want your answers before the end of January. (2/2)

We'd like to thank everyone who submitted answers in this challenge, such as David Ledbetter, Christoffer Strömblad, RunΞ and Chris Sistrunk.

We're happy to announce that the winner of our challenge is David Ledbetter. Congratulations David!

So what were the interesting thing that could be found in the released capture file? Below is a short summary of some things that can be found.

Telemetry data sent to mozilla.org

A surprising amount of information about the Firefox browser was sent to incoming.telemetry.mozilla.org, including things like:

  • Active browser addons
  • Active browser plugins
  • Firefox profile creation date
  • Browser search region
  • Default search engine
  • Regional locales
  • Screen width
  • Screen height
  • CPU vendor, family and model
  • HDD model, revision and type
  • Installed RAM
  • Operating system
  • Etc..

Here's an excerpt showing a part of the data sent to Mozilla:

"build": { "applicationId": "{ec8030f7-c20a-464f-9b0e-13a3a9e97384}", "applicationName": "Firefox", "architecture": "x86-64", "buildId": "20191002194346", "version": "69.0.2", "vendor": "Mozilla", "displayVersion": "69.0.2", "platformVersion": "69.0.2", "xpcomAbi": "x86_64-gcc3", "updaterAvailable": false }, "partner": { "distributionId": "canonical", "distributionVersion": "1.0", "partnerId": "ubuntu", "distributor": "canonical", "distributorChannel": "ubuntu", "partnerNames": [ "ubuntu" ] }, "system": { "memoryMB": 3943, "virtualMaxMB": null, "cpu": { "count": 1, "cores": 1, "vendor": "GenuineIntel", "family": 6, "model": 42, "stepping": 7, "l2cacheKB": 256, "l3cacheKB": 4096, "speedMHz": null, "extensions": [ "hasMMX", "hasSSE", "hasSSE2", "hasSSE3", "hasSSSE3", "hasSSE4_1", "hasSSE4_2", "hasAVX", "hasAES" ] }, "os": { "name": "Linux", "version": "5.0.0-31-generic", "locale": "en-US" }, "hdd": { "profile": { "model": null, "revision": null, "type": null }, "binary": { "model": null, "revision": null, "type": null }, "system": { "model": null, "revision": null, "type": null } }, "gfx": { "D2DEnabled": null, "DWriteEnabled": null, "ContentBackend": "Skia", "Headless": false, "adapters": [ { "description": "llvmpipe (LLVM 8.0, 256 bits)", "vendorID": "0xffff", "deviceID": "0xffff", "subsysID": null, "RAM": 3942, "driver": null, "driverVendor": "mesa/llvmpipe", "driverVersion": "19.0.8.0", "driverDate": null, "GPUActive": true } ], "monitors": [ { "screenWidth": 681, "screenHeight": 654 } ], "features": { "compositor": "basic", "gpuProcess": { "status": "unavailable" }, "wrQualified": { "status": "blocked-vendor-unsupported" }, "webrender": { "status": "opt-in" } } }, "appleModelId": null }, "settings": { "blocklistEnabled": true, "e10sEnabled": true, "e10sMultiProcesses": 8, "telemetryEnabled": false, "locale": "en-US", "intl": { "requestedLocales": [ "en-US" ], "availableLocales": [ "en-US", "en-CA", "en-GB" ], "appLocales": [ "en-US", "en-CA", "en-GB", "und" ], "systemLocales": [ "en-US" ], "regionalPrefsLocales": [ "sv-SE" ], "acceptLanguages": [ "en-US", "en" ] }, "update": { "channel": "release", "enabled": true, "autoDownload": false }, "userPrefs": { "browser.cache.disk.capacity": 1048576, "browser.search.region": "SE", "browser.search.widget.inNavBar": false, "network.trr.mode": 2 }, "sandbox": { "effectiveContentProcessLevel": 4 }, "addonCompatibilityCheckEnabled": true, "isDefaultBrowser": false, "defaultSearchEngine": "google", "defaultSearchEngineData": { "name": "Google", "loadPath": "[distribution]/searchplugins/locale/en-US/google.xml", "origin": "default", "submissionURL": "https://www.google.com/search?client=ubuntu&channel=fs&q=&ie=utf-8&oe=utf-8" } }, "profile": { "creationDate": 18183, "firstUseDate": 18183 }

You can use the following Wireshark display filter to find all the data sent to Mozilla:

http.request.method eq POST and http.host contains telemetry

Public IP Revealed in PCAP

The client's IP address was 192.168.4.20, which is part of the RFC 1918 192.168/16 private address space. It's therefore safe to assume that the client was behind a NAT (the client was in fact behind a double NAT). However, we noticed that the public IP of the client was revealed through multiple services in the captured network traffic. One of these services is the advertising exchange company AppNexus (adnxs.com), which sent the client's public IP address 193.235.19.252 in an X-Proxy-Origin HTTP header.

X-Proxy-Origin HTTP header in Wireshark

You can use the following Wireshark/tshark display filter to find X-Proxy-Origin headers:

http.response.line matches "x-proxy-origin" or http2.header.name matches "x-proxy-origin"

We are using the "matches" operator here instead of "contains" or "==" because we want to perform case insensitive matching. You might also notice that we need a completely different display filter syntax to match HTTP/2 headers compared to what we are used to with HTTP/1.1.

Monty Python "Majestik møøse" reference in reddit x-header

The reddit server 151.101.85.140 sends an HTTP/2 header called "x-moose" with a value of "majestic".

x-moose 1 : majestic header from reddit

This header refers to the opening credits of Monty Python and the Holy Grail.

Wi nøt trei a høliday in Sweden this yër?

Posted by Erik Hjelmvik on Tuesday, 17 March 2020 09:00:00 (UTC/GMT)

Tags: #HTTP/2#http2#TLS#decrypt#TLSI#PolarProxy#NetworkMiner#Wireshark#CS3Sthlm#CS3#Forensics#PCAP#ASCII-art

Share: Facebook   Twitter   Reddit   Hacker News Short URL: https://netresec.com/?b=2030e17


RawCap Redux

RawCap A new version of RawCap has been released today. This portable little sniffer now supports writing PCAP data to stdout and named pipes as an alternative to saving the captured packets to disk. We have also changed the target .NET Framework version from 2.0 to 4.7.2, so that you can run RawCap on a modern Windows OS without having to install a legacy .NET Framework.

Here’s a summary of the improvements in the new RawCap version (0.2.0.0) compared to the old version (0.1.5.0):

  • Uses .NET 4.7.2 instead of 2.0
  • Support for writing to stdout
  • Support for writing to named pipes
  • Large (64 MB) ring buffer to prevent packet drops
  • Automatic firewall configuration

Out of the software we develop and maintain here at Netresec, NetworkMiner is the most popular one. But you’re probably not aware that RawCap is our second most popular tool in terms of downloads, with around 100 unique downloads every day. RawCap started out as just being a quick hack that we released for free to the community in 2011 without expecting it to gain much attention. However, it quickly gained popularity, maybe due to the fact that it’s just a tiny .exe file and that it doesn’t require any external libraries or DLL’s to sniff network traffic (other than the .NET Framework).

RawCap embraces the Unix philosophy to do only one thing, and do it well. Thanks to RawCap’s simplicity we have only needed to make a few minor updates of the tool since its first release 9 years ago. However, today we’re finally adding some new features that have been requested by users over the years. One such feature is that RawCap now automatically creates a Windows firewall rule when the tool is started. Before this feature was introduced users would have to run wf.msc (i.e. the "Windows Defender Firewall with Advanced Security") and manually create an inbound rule to allow RawCap.exe to receive incoming traffic. Without such a firewall rule RawCap would only be able to capture outgoing traffic.

RawCap can be started in two different modes. Either as an interactive console application, or as a “normal” command line utility. Run RawCap.exe without any arguments, or simply double click the RawCap.exe icon to use the interactive mode. You will then be asked which interface to capture packets from and what filename you’d like to save them to.

F:\Tools>RawCap.exe
Network interfaces:
0.     192.168.0.17    Local Area Connection
1.     192.168.0.47    Wireless Network Connection
2.     90.130.211.54   3G UMTS Internet
3.     192.168.111.1   VMware Network Adapter VMnet1
4.     192.168.222.1   VMware Network Adapter VMnet2
5.     127.0.0.1       Loopback Pseudo-Interface
Select network interface to sniff [default '0']: 1
Output path or filename [default 'dumpfile.pcap']:
Sniffing IP : 192.168.0.47
Output File : dumpfile.pcap
 --- Press [Ctrl]+C to stop ---
Packets     : 1337

The other alternative is to supply all the arguments to RawCap when it is started. Use “RawCap --help” to show which arguments you can use. You’ll need to use this mode if you want to write the captured traffic to standard output (stdout) or a named pipe, or if you want RawCap to automatically stop capturing after a certain time or packet count.

F:\Tools>RawCap.exe --help
NETRESEC RawCap version 0.2.0.0

Usage: RawCap.exe [OPTIONS] <interface> <pcap_target>
 <interface> can be an interface number or IP address
 <pcap_target> can be filename, stdout (-) or named pipe (starting with \\.\pipe\)

OPTIONS:
 -f          Flush data to file after each packet (no buffer)
 -c <count>  Stop sniffing after receiving <count> packets
 -s <sec>    Stop sniffing after <sec> seconds
 -m          Disable automatic creation of RawCap firewall entry
 -q          Quiet, don't print packet count to standard out

INTERFACES:
 0.     IP        : 169.254.63.243
        NIC Name  : Local Area Connection
        NIC Type  : Ethernet

 1.     IP        : 192.168.1.129
        NIC Name  : WiFi
        NIC Type  : Wireless80211

 2.     IP        : 127.0.0.1
        NIC Name  : Loopback Pseudo-Interface 1
        NIC Type  : Loopback

 3.     IP        : 10.165.240.132
        NIC Name  : Mobile 12
        NIC Type  : Wwanpp

Example 1: RawCap.exe 0 dumpfile.pcap
Example 2: RawCap.exe -s 60 127.0.0.1 localhost.pcap
Example 3: RawCap.exe 127.0.0.1 \\.\pipe\RawCap
Example 4: RawCap.exe -q 127.0.0.1 - | Wireshark.exe -i - -k

As you can see, running “RawCap.exe -s 60 127.0.0.1 localhost.pcap” will capture packets from localhost to a file called “localhost.pcap” for 60 seconds and then exit.

There are a couple of drawbacks with the new RawCap version though, it is a larger binary (48kB instead of 23kB) and it uses more CPU and RAM compared to the old version. We will therefore continue making the old RawCap version available to anyone who might need it.

Visit the RawCap product page to download this tool and learn more.

Posted by Erik Hjelmvik on Thursday, 30 January 2020 14:32:00 (UTC/GMT)

Tags: #Netresec#RawCap#sniffer#PCAP#named pipe#Wireshark#WiFi#loopback#127.0.0.1

Share: Facebook   Twitter   Reddit   Hacker News Short URL: https://netresec.com/?b=201683e


Sharing a PCAP with Decrypted HTTPS

Modern malware and botnet C2 protocols use TLS encryption in order to blend in with "normal" web traffic, sometimes even using legitimate services like Twitter or Instagram.

I did a live demo at the CS3Sthlm conference last year, titled "TLS Interception and Decryption", where I showed how TLS interception can be used to decrypt and analyze malicious HTTPS network traffic. During the demo I used DNS-over-HTTPS (DoH) and posted messages to Pastebin and Twitter, pretending to be a malware or malicious actor. The HTTPS network traffic was decrypted and analyzed live as part of my demo. The CS3Sthlm organizers have posted a video recording of the live demo on YouTube.

Erik presenting PolarProxy at CS3Sthlm, photo credit: CS3Sthlm

Image: Erik demoing TLS Interception and Decryption at CS3Sthlm 2019

We are now releasing a PCAP file with the decrypted network traffic captured during this live demo here:

» https://media.netresec.com/pcap/proxy-191023-091924.pcap «

This blog post provides a step-by-step walk-through of the decrypted HTTPS traffic in the released capture file.

The TLS decryption was performed by connecting a laptop to a custom WiFi access point, which was a Raspberry Pi configured as in our "Raspberry Pi WiFi Access Point with TLS Inspection" blog post. I additionally enabled the PCAP-over-IP feature in PolarProxy by starting it with the "--pcapoverip 57012" option. This allowed me to connect with Wireshark and NetworkMiner to TCP port 57012 on the TLS proxy and stream the decrypted traffic in order to perform live network traffic analysis.

Laptop, Raspberry Pi, PolarProxy, Internet ASCII

Image: Live demo network with Laptop (Browser, NetworkMiner, Wireshark), Raspberry Pi (PolarProxy) and the Internet.

Below follows a breakdown of various significant events of my demo and where you can find these events in the released capture file.

DNS lookup of "www.google.com" using DoH

  • Frame: 833
  • Protocol: DoH using HTTP/2 POST
  • Five tuple: 192.168.4.20:52694 104.16.248.249:80 TCP
DoH lookup of www.google.com shown in NetworkMiner DoH lookup of www.google.com shown in Wireshark

Google search for "tibetan fox psbattle"

  • Frame: 2292
  • Protocol: HTTP/2
  • Five tuple: 192.168.4.20:52716 216.58.211.4:80 TCP
Google search for 'tibetan fox psbattle' in Wireshark Google search for 'tibetan fox psbattle' in NetworkMiner

Tibetan Fox image downloaded from reddit

  • Frame: 3457
  • Protocol: HTTP/2
  • Five tuple: 192.168.4.20:52728 151.101.85.140:80 TCP
Image download from reddit shown in NetworkMiner

Orginal "tibetan fox" image downloaded from this reddit thread.

Tibetan Fox Remix Image HTTP/2 Download

  • Frame: 5805
  • Protocol: HTTP/2
  • Five tuple: 192.168.4.20:52769 151.101.84.193:80 TCP
Images downloaded via HTTP/2

DNS Lookup of "cs3sthlm.se"

  • Frame: 13494
  • Protocol: DoH using HTTP/2 POST
  • Five tuple: 192.168.4.20:52699 104.16.249.249:80 TCP

Images downloaded from CS3Sthlm's website

  • Frame: 14134
  • Protocol: HTTP/1.1
  • Five tuple: 192.168.4.20:52896 192.195.142.160:80 TCP
Images downloaded from CS3Sthlm's website

Data sent in HTTP/2 POST to Pastebin

  • Frame: 18572
  • Protocol: HTTP/2 POST
  • Five tuple: 192.168.4.20:52904 104.22.2.84:80 TCP
Data sent to Pastebin in HTTP/2 POST

The file "post.php.form-data" contains the data sent to Pastebin in the HTTP/2 POST request. Here are the reassembled contents of that file, including the "hello cs3 I am a malware" message:

-----------------------------54168074520069581482009826076
Content-Disposition: form-data; name="csrf_token_post"

MTU3MTgyMjg5OTFwcjBzODJaQ0NuUk9PT1B3ZTl0b20zdFg3ZkhXQ1R4
-----------------------------54168074520069581482009826076
Content-Disposition: form-data; name="submit_hidden"

submit_hidden
-----------------------------54168074520069581482009826076
Content-Disposition: form-data; name="paste_code"

hello cs3 I am a malware
-----------------------------54168074520069581482009826076
Content-Disposition: form-data; name="paste_format"

1
-----------------------------54168074520069581482009826076
Content-Disposition: form-data; name="paste_expire_date"

1H
-----------------------------54168074520069581482009826076
Content-Disposition: form-data; name="paste_private"

0
-----------------------------54168074520069581482009826076
Content-Disposition: form-data; name="paste_name"

malware traffic
-----------------------------54168074520069581482009826076--

Mallory80756920 logs in to Twitter

  • Frame: 24881
  • Protocol: HTTP/2 POST
  • Five tuple: 192.168.4.20:53210 104.244.42.65:80 TCP
Twitter credentials for Mallory80756920

Mallory80756920 posts a Tweet

  • Frame: 26993
  • Protocol: HTTP/2 POST
  • Five tuple: 192.168.4.20:53251 104.244.42.66:80 TCP

Mallory80756920 tweeted "Hello CS3! I'm in you!". The data was sent to twitter using an HTTP/2 POST request.

Twitter post in Wireshark Twitter post in NetworkMiner

Conclusions

A great deal of the interesting TLS traffic in the analyzed capture file is using the HTTP/2 protocol. This doesn't come as a surprise since more than half of all HTTPS traffic is using HTTP/2 nowadays (sources: server protocol statistics, client protocol statistics). It is therefore essential to be able to analyze HTTP/2 traffic if you have a TLS inspection (TLSI) solution in place. Unfortunately many TLSI products don't yet support the HTTP/2 protocol.

Wireshark was one of the first network traffic analysis tools to implement HTTP/2 support, much thanks to Alexis La Goutte. However, Wireshark's excellent "File > Export Objects" doesn't yet support extraction of files from HTTP/2 traffic. There are other ways to extract HTTP/2 file transfers with Wireshark, but they require a few additional steps in order to carve out the file to disk.

Luckily NetworkMiner extracts files from HTTP/2 as of version 2.5. In fact, we believe NetworkMiner is the first open source tool to support automatic HTTP/2 file extraction from PCAP.

Finally, I'd like to stress the point that modern malware use HTTPS, so you need to have a TLSI solution in place to analyze the malicious traffic. As the majority of all HTTPS traffic is using HTTP/2 you also need to ensure that you're able to analyze HTTP/2 traffic passing through your TLSI solution.

Posted by Erik Hjelmvik on Monday, 13 January 2020 12:45:00 (UTC/GMT)

Tags: #HTTP/2#http2#DoH#TLS#Google#decrypt#HTTPS#TLSI#TLS Inspection#TLS Interception#PolarProxy#NetworkMiner#Wireshark#CS3Sthlm#CS3#Forensics#PCAP#Video

Share: Facebook   Twitter   Reddit   Hacker News Short URL: https://netresec.com/?b=2015d89


The NSA HSTS Security Feature Mystery

NSA TLSI advisory header

I recently stumbled across an NSA Cyber Advisory titled Managing Risk from Transport Layer Security Inspection (U/OO/212028-19) after first learning about it through Jonas Lejon’s blog post NSA varnar för TLS-inspektion (Swedish). I read the NSA report with great interest since I wanted to see how our own TLS interception tool PolarProxy stands up to the risks identified in the advisory.

I highly respect the NSA’s knowledge in the fields of cryptography and security, which is why I read the advisory as if it was the definite guide on how to perform TLS inspection in a secure manner. However, towards the end of the advisory I got stuck on this paragraph, which I was unable to understand:

HTTP Strict Transport Security (HSTS) includes a security feature that binds the HTTP session to the specific TLS session used. TLSI systems that ignore the underlying HTTP headers will cause HSTS sessions to be rejected by the client application, the server, or both.

WUT?!?! HSTS (RFC 6797) is designed to protect against attacks like Moxie Marlinspike’s 10 year old sslstrip, which fools the client into using unencrypted HTTP instead of HTTPS. As far as I know, HSTS does not support binding an HTTP session to a specific TLS session.

What is HSTS?

HSTS is a simple HTTP header sent by the web server to inform the browser that it should only load the site using HTTPS. The header can look like this:

strict-transport-security: max-age=47111337; includeSubDomains; preload

NetworkMiner 2.5 showing HSTS headers from HTTP/1.1 and HTTP/2 traffic

Image: NetworkMiner 2.5 showing HSTS headers from HTTP/1.1 and HTTP/2 traffic

The PCAP file loaded into NetworkMiner in screenshot above contains HTTPS traffic that has been decrypted by PolarProxy. You can also use Wireshark or tshark to find HSTS headers by using the following display filter:

http.response.line matches "Strict-Transport-Security" or http2.header.name matches "Strict-Transport-Security"

Notice the use of “matches” to get case insensitive matching of “Strict-Transport-Security” and the duplicated statements required to get the filter to match headers in both HTTP/1.1 and HTTP/2.

Back to the NSA Advisory

I simply couldn’t understand NSA’s statement about the HSTS “security feature” that binds the HTTP session to the specific TLS session used, because I’m not aware of any such feature in HSTS and my google-fu was to weak to find any such feature. I therefore resorted to asking folks on Twitter if they knew about this feature.

Nick Sullivan (Head of Research and Cryptography at Cloudflare) kindly replied on twitter that they probably mean “Token Binding” (RFC 8471). Peter Wu (Wireshark core developer and TLS expert) additionally replied that the NSA perhaps were referring to the Sec-Token-Binding header name in RFC 8473 (which has nothing to do with HSTS).

Backed by these two experts in TLS and HTTPS I can confidently conclude that the authors of the NSA’s Transport Layer Security Inspection (TLSI) advisory have either misunderstood what HSTS is or made some form of typo. I have reported this error to the NSA, but have not yet received any response.

Other Issues in NSA’s TLSI Advisory

This experience dented my faith in the TLS expertise of the NSA in general and in particular the authors of this advisory. I therefore decided to re-read the TLSI advisory, but this time without the “NSA knows this stuff” glasses I had on before. This time I found several additional claims and statements, which I didn’t agree with, in the four page advisory.

To start with, the first figure in the document depicts two setups where one is allowing end-to-end encryption between the client and server, while the other is using TLS inspection.

Encrypted Traffic (top) and TLS Inspection (bottom) as shown in NSA’s TLSI advisory

Image: Encrypted Traffic (top) and TLS Inspection (bottom) as shown in NSA’s TLSI advisory

In the end-to-end setup we see the malicious traffic passing straight to the client, while in the second setup the malicious traffic is blocked by the TLSI device. This image is accompanied by the following text:

A TLSI capability implemented within a forward proxy between the edge of the enterprise network and an external network such as the Internet protects enterprise clients from the high risk environment outside the forward proxy.

My experience is that blocking traffic in this way is more likely to provide a false sense of security than improved protection against malware. It is better to use TLSI to detect intrusions than to try to block them.

This probably sounds counter-intuitive, as you might reason that “if you can detect it, why can't you prevent it?”. I’m not going to go into a lengthy explanation of the “Prevention Eventually Fails” paradigm here, instead I’d recommend reading Richard Bejtlichs book “The Tao of Network Security Monitoring” or his more recent book “The Practice of Network Security Monitoring”. You can also read Richards blog post about ”The Problem with Automated Defenses” or Phil Hagen’s “What to Do When Threat Prevention Fails”.

TLSI products should primarily be used to provide visibility in order to detect and respond to malware and intrusions. Many TLSI products can block some attacks, but they don’t really provide perimeter security. Unfortunately the NSA advisory might further strengthen this false sense of security with the mentioned image and accompanying text.

DO IT WELL, DO IT ONCE

The NSA advisory states:

To minimize the risks described above, breaking and inspecting TLS traffic should only be conducted once within the enterprise network. Redundant TLSI, wherein a client-server traffic flow is decrypted, inspected, and re-encrypted by one forward proxy and is then forwarded to a second forward proxy for more of the same, should not be performed.

In general, I agree with this statement. Unfortunately many TLSI products do not “do it well”, which is why “do it once” is not always enough. One such situation is when a PC is believed to be infected with malware, but further investigation is required to know for sure. Many TLSI products apply lock-in techniques that prevent incident responders from analyzing the decrypted traffic with external tools. This forces IR teams to add an extra TLS proxy when their enterprise TLSI product does not provide sufficient visibility. PolarProxy is, in fact, designed to support that type of agile TLSI deployment, in order to enable decryption and inspection of TLS traffic from a particular machine during an incident.

Final Words about the Advisory and TLS Inspection

Even through this blog post criticizes parts of the NSA TLSI advisory, I’d still like to end with saying that it also brings a lot of good stuff to the table. The issues mentioned in this blog post are actually just minor ones, which hopefully won’t have any negative impact on future TLSI deployments. In fact, the positive aspects of the advisory by far outweighs the negative ones. I also hope this blog post can help get more discussions going about TLS inspection, such as if we need it, what problems it can solve and what risks we take by deploying it.

UPDATE, 16 December 2019

The NSA released an updated version of the advisory today (1U/OO/212028-19). The advisory now says:

  • TLS Token Binding binds security tokens to the specific TLS session used. TLSI systems can cause the sessions or tokens to be rejected by the client application, the server, or both.
  • Hypertext Transfer Protocol Strict Transport Security (HSTS) requires that Hypertext Transfer Protocol over TLS (HTTPS) is used in the future with trusted certificates and that all content is received via HTTPS as well. If a TLS client application attempts to follow the HSTS requirements but does not trust the separate TLSI CA, the client will reject the TLSI sessions and prevent users from clicking-through browser warnings.

Thanks for updating!

Posted by Erik Hjelmvik on Tuesday, 26 November 2019 19:18:00 (UTC/GMT)

Tags: #TLSI#TLS Inspection#TLS Interception#PolarProxy#TLS#NetworkMiner#Wireshark

Share: Facebook   Twitter   Reddit   Hacker News Short URL: https://netresec.com/?b=19B5cbd


Raspberry PI WiFi Access Point with TLS Inspection

This is a how-to guide for setting up a Raspberry Pi as a WiFi Access Point, which acts as a transparent TLS proxy and saves the decrypted traffic in PCAP files.

Raspberry Pi 4 Model B running PolarProxy
Image: Raspberry Pi 4 Model B running PolarProxy

Step 1: Install PolarProxy for Linux ARM

We will start with installing PolarProxy, which will be used for the TLS decryption and re-encryption. The steps are almost identical to those in the official PolarProxy installation guide, except here we will download the "linux-arm" build of PolarProxy instead of the x64 version.

sudo adduser --system --shell /bin/bash proxyuser
sudo mkdir /var/log/PolarProxy
sudo chown proxyuser:root /var/log/PolarProxy/
sudo chmod 0775 /var/log/PolarProxy/
sudo su - proxyuser
mkdir ~/PolarProxy
cd ~/PolarProxy/
curl https://www.netresec.com/?download=PolarProxy_linux-arm | tar -xzf -
exit
sudo cp /home/proxyuser/PolarProxy/PolarProxy.service /etc/systemd/system/PolarProxy.service
sudo systemctl enable PolarProxy.service
sudo systemctl start PolarProxy.service

Note: The installation instructions above will fail on 64-bit ARM Linux OS's since the downloaded PolarProxy tarball is compiled for 32-bit ARM Linux. Luckily, we do have a linux-arm64 build as well, which is available here:
https://www.netresec.com/?download=PolarProxy_linux-arm64

Verify that the PolarProxy service is running as expected with these commands:

systemctl status PolarProxy.service
journalctl -t PolarProxy

Step 2: Set up your Pi as a WiFi AP

The Raspberry Pi Foundation have a great guide for "Setting up a Raspberry Pi as a Wireless Access Point". Follow the instructions in their guide for the NAT mode setup (first section), but replace the iptables config with this:

sudo iptables -t nat -A POSTROUTING -o eth0 -j MASQUERADE
sudo iptables -A INPUT -i wlan0 -p tcp --dport 10443 -m state --state NEW -j ACCEPT
sudo iptables -t nat -A PREROUTING -i wlan0 -p tcp --dport 443 -j REDIRECT --to 10443
Then save the iptables rules with:
sudo sh -c "iptables-save > /etc/iptables.ipv4.nat"
Finally, edit /etc/rc.local and add this iptables-restore command just above "exit 0" to install the rules on boot.
iptables-restore < /etc/iptables.ipv4.nat

Step 3: Configure the Clients

The final step is to connect the clients (phones, tablets or computers) to the Raspberry Pi WiFi Access Point and install the root CA from PolarProxy.

Follow the instructions for "Trusting the PolarProxy root CA" in the official PolarProxy setup guide to install the public certificate from the TLS proxy in your clients. The certificate can be downloaded from the Raspberry Pi by browsing to http://192.168.4.1:10080/polarproxy.cer.

PCAP PCAP PCAP

Your Raspberry Pi WiFi AP will now intercept all HTTPS traffic going to tcp/443 and save the decrypted traffic in PCAP files, one per hour. The PCAP files with decrypted TLS traffic can be found in the /var/log/PolarProxy/ directory of your Raspberry Pi.

pi@raspberrypi:/var/log/PolarProxy $ ls *.pcap
proxy-190925-075704.pcap proxy-190925-152902.pcap
proxy-190925-085704.pcap proxy-190925-162902.pcap
proxy-190925-095704.pcap proxy-190925-172902.pcap
proxy-190925-105704.pcap proxy-190925-182902.pcap
proxy-190925-115704.pcap proxy-190926-062902.pcap
proxy-190925-125704.pcap proxy-190926-072902.pcap
proxy-190925-132704.pcap proxy-190926-082902.pcap
proxy-190925-132902.pcap proxy-190926-092902.pcap
proxy-190925-142902.pcap proxy-190926-102902.pcap

HTTP/2 traffic to Facebook opened in Wireshark
Image: Decrypted HTTP/2 traffic to Facebook opened in Wireshark

Posted by Erik Hjelmvik on Thursday, 26 September 2019 11:37:00 (UTC/GMT)

Tags: #PolarProxy#PCAP#WiFi#TLS#SSL#HTTPS#Wireshark#http2

Share: Facebook   Twitter   Reddit   Hacker News Short URL: https://netresec.com/?b=199dc9a

2019 June

PolarProxy Released

2019 January

Video: TrickBot and ETERNALCHAMPION

2018 September

Reverse Engineering Proprietary ICS Protocols

2017 March

CapLoader 1.5 Released

2016 October

Reading cached packets with Wireshark

X / twitter

NETRESEC on X / Twitter: @netresec

Mastodon

NETRESEC on Mastodon: @netresec@infosec.exchange