Showing blog posts from 2024

rss Google News

CapLoader 1.9.7 Released

CapLoader 1.9.7

A new release of CapLoader has been published! Some of the changes can be seen directly in the user interface, such as Community ID values for flows and a few other new columns in the Flows and Services tabs. Other improvements are more subtle, like improved detection of remote management protocols and malicious C2 protocols.

User Interface Improvements

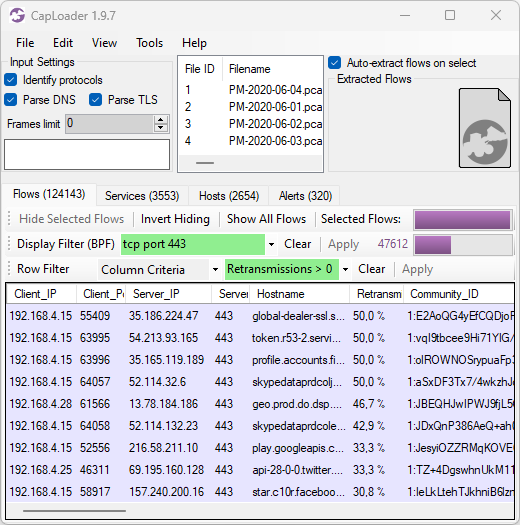
The most important user interface update is probably the addition of a Community_ID column in the Flows tab, which shows a unique Community ID string for each flow. The community ID is a common flow identifier that can be used to correlate traffic in CapLoader with alerts or events from tools like Zeek, Suricata, MISP or Arkime.

CapLoader 1.9.4 with Retransmissions and Community ID

CapLoader now has a column named Retransmissions in both Flows and Services tab, which shows an estimate of how many percent of the packets in each flow or service that are retransmissions. This value can be used to quickly diagnose a network issue without having to inspect network traffic on a packet-by-packet level.

We have also added a column named Client_IP_TTL to CapLoader’s Flows tab, which can be used to differentiate between NAT’ed clients that share a single public IP address – provided that they run operating systems with different IP TTL of course! There is also a new column in the Services tab called First_Seen, which shows when each service was first observed in the analyzed network traffic.

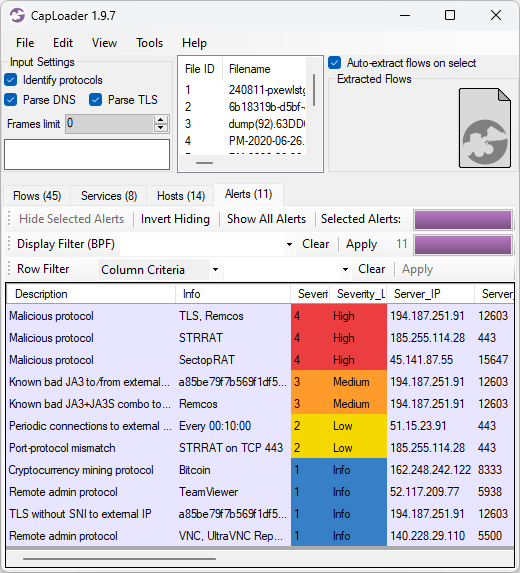
The Severity and Severity_Label columns in the Alerts tab are now colored according to severity level, where red means High, orange is Medium, yellow is Low and blue is Info (the exact color codes were borrowed from the US Homeland Security Advisory System scale).

Alerts in CapLoader 1.9.4

We have also included a handy little feature that allows you to append additional PCAP files to an existing analysis session simply by holding down Ctrl while drag-and-dropping another capture file onto CapLoader. The “Append File(s)” option is also available under CapLoader’s File menu.

Even More Protocols Identified

CapLoader’s unique ability to identify protocols regardless of port has been improved and we’ve also added detections for several new protocols. For this release we’ve focused adding detection for remote monitoring and management (RMM) protocols, such as ConnectWise (formerly ScreenConnect), AnyDesk, NetSupport (including NetSupport RAT), TeamViewer (including TVRAT) and RMS (Remote Utilities). This enables CapLoader to alert whenever an RMM protocol is detected.

We’ve also added detection of several new malware protocols, including Matanbuchus, Meduza Stealer, SectopRAT, STRRAT and zgRAT.

Even More Protocols Decapsulated

DECAPSULATE ALL THE THINGS

CapLoader already decapsulates flows inside of GRE, VXLAN and CapWap. With this release we add support for decapsulation of Teredo, GTP-U, TZSP as well as IP-in-IP traffic, so that tunneled traffic can be analyzed without any additional effort.

Credits

I would like to thank Jarmo Lahtiranta for the TZSP idea and Lenny Hansson for pointing out the need for improved protocol detection. I would also like to thank Christian Kreibich and his fellow Corelight devs for creating and open sourcing the Community ID project.

Updating to the Latest Release

Users who have already purchased a license for CapLoader can download a free update to version 1.9.7 from our customer portal or by clicking “Check for Updates” in CapLoader’s Help menu.

Posted by Erik Hjelmvik on Friday, 06 September 2024 09:45:00 (UTC/GMT)

Tags: #CapLoader#TZSP#TTL

Share: Facebook   Twitter   Reddit   Hacker News Short URL: https://netresec.com/?b=2499359


How to Inspect TLS Encrypted Traffic

Do you want to analyze decrypted TLS traffic in Wireshark or let an IDS, like Suricata, Snort or Zeek, inspect the application layer data of potentially malicious TLS encrypted traffic? There are many different TLS inspection solutions to choose from, but not all of them might be suitable for the specific challenge you’re facing. In this blog post I describe three different methods for decrypting TLS and explain when to use one or the other.

RSA Private Key TLS Key Log TLS Inspection Proxy
Works for all ciphers No (DHE cipher suites not supported) Yes Yes
TLS 1.3 supported No Yes Yes
Zero client configuration required Yes No (pre-master secrets must be logged or extracted from TLS libraries) No (root CA certificate must be installed)
Decrypts traffic from any application No (most applications use modern ciphers with forward secrecy, which RSA doesn’t provide) No (each method for TLS key extraction typically only supports a specific set of applications or TLS libraries) No (apps that use certificate pinning or a custom certificate trust store cannot be intercepted without patching the app)
L7 traffic in PCAP files can be analyzed without decrypting TLS No No Yes
Allows decrypted traffic to be mirrored to a network interface No No Yes

RSA Private Key

TLS decryption with a private RSA key was for a long time the preferred method for inspecting SSL and TLS traffic. This approach allowed anyone with access to the server’s private RSA key to decrypt the traffic and inspect the application layer (L7) communication.

The primary drawback with RSA private key decryption is that a stolen or leaked private RSA key can be used by an attacker to decrypt all previously captured traffic from that server, if RSA key exchange is being used. Modern TLS stacks have therefore deprecated such ciphers in favor of ones that support forward secrecy, which typically perform an ephemeral Diffie–Hellman (DHE) key exchange instead of reusing the same private RSA key over and over. This means that the RSA private key decryption method cannot be used if the client and server are using a key exchange algorithm that supports forward secrecy.

RSA private key decryption can only be performed when all these conditions are met:

  • The protocol version is SSL 3.0, TLS 1.0, TLS 1.1 or TLS 1.2 (RSA was removed in TLS 1.3)
  • The server has selected a cipher suite that use RSA key exchange, such as TLS_RSA_WITH_AES_256_GCM_SHA384, TLS_RSA_WITH_AES_128_GCM_SHA256, TLS_RSA_WITH_AES_256_CBC_SHA256, TLS_RSA_WITH_AES_128_CBC_SHA256, TLS_RSA_WITH_AES_256_CBC_SHA or TLS_RSA_WITH_AES_128_CBC_SHA
  • The private key matches the server certificate (traffic cannot be decrypted with a client certificate or an intermediate or root certificate)
  • The session has not been resumed (the handshake must include a Client Key Exchange message)

This Wireshark display filter can be used to check if the server has selected an RSA cipher:

tls.handshake.type == 2 and tls.handshake.ciphersuite in {10,47,53,60,61,156,157}

You can check for a client key exchange message with:

tls.handshake.type == 16

A private RSA key can be loaded into Wireshark by clicking Edit, Preferences and RSA Keys. Another alternative is to use the command line tool tshark’s -ouat:rsa_keys switch like this:

tshark -r tls.pcap -ouat:rsa_keys:'"/path/rsa.key",""'

TLS Key Log

Wireshark can decrypt the TLS layer in captured network traffic if the pre-master secrets used to establish the encrypted connection are provided. These secrets, or encryption key material, can be loaded into Wireshark from an SSLKEYLOGFILE by clicking Edit, Preferences, Protocols, TLS, and setting the (Pre)-Master-Secret log filename to the path of your SSLKEYLOGFILE.
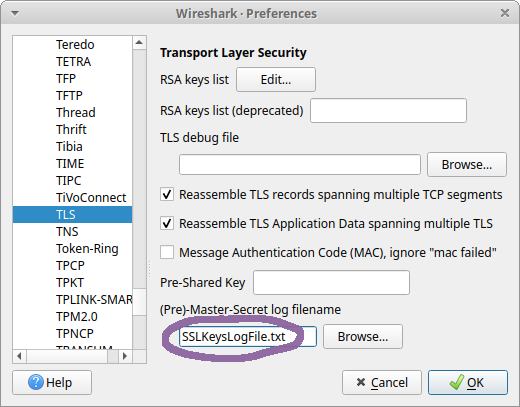
Wireshark SSLKEYLOGFILE

Another alternative is to encode the key material as metadata in a pcap-ng file with editcap like this:

editcap --inject-secrets tls,SSLKEYLOG.txt tls.pcap tls-and-keys.pcapng

The primary drawback with the TLS key log decryption method is that only Wireshark and tshark can be used to analyze the decrypted TLS traffic. You also need to get hold of the keys or pre-master secrets in order to perform the decryption. Some applications, such as Firefox, Chrome and curl, can be configured to export a key log. Another alternative is to install an agent that extracts key material from specific TLS libraries.

The limitation of only being able to extract keys from a specific set of applications or TLS libraries makes the TLS key log method unsuitable for analyzing TLS encrypted C2 traffic from malware, which often use custom TLS libraries. It is also difficult to send decrypted TLS traffic to an IDS or a network security monitoring tool using a TLS key log. If you, on the other hand, want to analyze network traffic from your own Firefox or Chrome browser in Wireshark, then the TLS key log approach is probably the best solution.

TLS Inspection Proxy

A TLS inspection proxy acts as a man-in-the-middle that intercepts and decrypts TLS traffic for inspection, it then re-encrypts the traffic and forwards it to the intended destination.
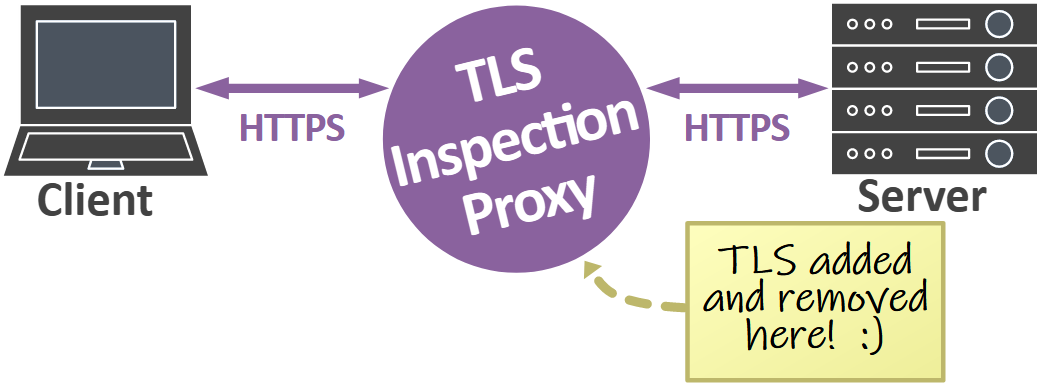
TLS inspection proxy

A major advantage of using a TLS inspection proxy is that decrypted TLS traffic can be analyzed from applications even if they use modern ciphers with forward secrecy and don’t support logging of TLS keys. The drawback, however, is that clients have to trust the root CA certificate that the proxy is using.

TLS inspection proxies often differ in how they make the decrypted traffic available to external tools, if at all. In fact, many TLS inspection proxies and Next-Generation Firewalls (NGFW) only make the decrypted payload available to the internal application or appliance. Such an approach prevents analysis of the decrypted traffic with an external tool, like Wireshark, Snort, Suricata, Zeek or NetworkMiner.

Another approach, used by proxies like mitmproxy, is to save a TLS key log for all proxied traffic. That approach allows captured TLS traffic to or from the proxy to be decrypted and inspected with Wireshark, but the application layer traffic cannot be inspected with other tools that don’t support TLS decryption using a key log.

The third and most integration friendly approach is to save the decrypted traffic in clear text form, so that other applications can inspect the unencrypted traffic without having to decrypt TLS. Some TLS proxies, like PolarProxy and SSLsplit, can even save the decrypted traffic to a PCAP file. Decrypted TLS traffic in PCAP format can easily be ingested into other tools or be replayed to a network interface for inspection by an external security appliance.

Best Practices

The list below can be used to select the best suited TLS inspection method for the particular challenge you’re tasked with.

I want to...

  • Inspect traffic from my browser.

    Use TLS key log to inspect traffic from Firefox, Chrome and curl. Use a TLS inspection proxy for other browsers.

  • Inspect traffic to my HTTPS website.

    Use RSA private key inspection if it is acceptable to use an older TLS version and less secure ciphers. Use a TLS key log if your web server can be configured to export one or if you have an agent based key extraction solution that supports the TLS library used by the web server. Use a TLS inspection proxy if you want to inspect the traffic with something other than Wireshark.

  • Inspect potentially malicious TLS traffic with an IDS or security appliance.

    Use a TLS inspection proxy.

  • Inspect traffic from my operating system.

    Use a TLS inspection proxy.

  • Inspect traffic from my mobile phone, smart device or other embedded device.

    Use a TLS inspection proxy.

  • Inspect traffic from a proprietary game, app or service.

    Use a TLS inspection proxy.

Posted by Erik Hjelmvik on Wednesday, 07 August 2024 11:40:00 (UTC/GMT)

Tags: #TLS#TLS Inspection#PolarProxy#SSLKEYLOGFILE#Wireshark#PCAP

Share: Facebook   Twitter   Reddit   Hacker News Short URL: https://netresec.com/?b=248b1db


Online Network Forensics Class

I will teach two live online classes this autumn, one in October and one in November. The subject for both classes is network forensics for incident response.

PCAP - Network Forensics Training - October 21-24, November 18-21

The training is split into four interactive morning sessions, so that you have the afternoon free to either practice what you learned in class or catch up with your “normal” day job. The number of attendees will be limited in order to provide a good environment for taking questions. A maximum of 15 attendees will be accepted per class. The registration will be closed once we reach this attendee limit.

  • 🇺🇸 October 21-24, 2024: PCAP in the Morning US
    ⏲️ Time: 9:30 AM to 1:30 PM EDT
    💸 Price: $1,000 USD per student
  • 🇪🇺 November 18-21, 2024: PCAP in the Morning Europe
    ⏲️ Time: 8:30 AM to 12:30 PM CET
    💸 Price: € 920 EUR per student

We will analyze a 14 GB PCAP data set captured on an Internet connected network with multiple clients, an AD server, a web server, an android tablet and some embedded devices. As you’ve probably guessed, the capture files contain traffic from multiple intrusions by various attackers, including APT style attackers and botnet operators. The initial attack vectors are using techniques like exploitation of web vulnerabilities, spear phishing, a supply chain attack and a man-on-the-side attack! In this training you'll get first-hand experience looking at C2 and backdoor protocols, such as Cobalt Strike, TrickBot, njRAT and Meterpreter.

See our training page for more info about the “PCAP in the Morning” classes.

To sign up for a class, simply send an email to sales@netresec.com with the class dates, your name and invoice address. We will then send you a PayPal payment link that you can use to complete your training registration.

Hope to see you there!

Erik H

Cheers,
Erik Hjelmvik
Creator of NetworkMiner and founder of Netresec

Posted by Erik Hjelmvik on Monday, 03 June 2024 10:20:00 (UTC/GMT)

Tags: #network forensics#PCAP

Share: Facebook   Twitter   Reddit   Hacker News Short URL: https://netresec.com/?b=2462e4f


Remote Sniffing from Mikrotik Routers

One of the new features in NetworkMiner 2.9 is a TZSP streaming server. It is designed to read a real-time stream of sniffed packets from Mikrotik routers. This method for remote sniffing can be used to capture packets regardless if NetworkMiner is running in Windows or Linux.

Sniff Packets with Mikrotik TZSP to NetworkMiner

How to Sniff Packets with TZSP

Open a console or terminal on the Mikrotik router and run “/tool sniffer print” to see the current settings. Then run the following commands to configure the sniffer:

  • /tool sniffer
  • set streaming-enabled=yes
  • set streaming-server=10.1.2.3:37008
  • set filter-stream=yes

Replace 10.1.2.3 with the IP address of the computer running NetworkMiner

It is also possible to activate the sniffer from the RouterOS WebFig interface.

  • Expand the “Tools” section
  • Click “Packet Sniffer”
  • Check “Streaming Enabled”
  • Enter IP of computer running NetworkMiner in Server
  • Enter 37008 as Port
  • Check “Filter Stream”
  • Click the “Apply” button at the top
Mikrotik WebFig Packet Sniffer settings

The “filter-stream” setting prevents the sniffer from capturing packets that are sent to the streaming-server (i.e. NetworkMiner). This setting must be enabled to avoid a snowball effect, where copies of previously captured packets get sniffed and re-transmitted to the streaming-server.

The next step is to open the TZSP window in NetworkMiner, which you’ll find under “File, Receive TZSP Stream”.

NetworkMiner TZSP Sniffer

Click “Start” in NetworkMiner’s TZSP window, so that it listens for an incoming TZSP stream on UDP port 57008. Go back to the Mikrotik router, where you start the sniffer with “/tool sniffer start” or by clicking the “Start” button in the WebFig. You should now see the Frames counter increasing in NetworkMiner's TZSP window. You’ll probably also notice that artifacts get added to the main NetworkMiner window in the background as more packets are received.

Close the sniffer by running “/tool sniffer stop” or clicking the “Stop” button in WebFig, then click “Stop” in NetworkMiner. You can now close NetworkMiner’s TZSP window to view the artifacts that NeworkMiner has extracted from the captured traffic.

Posted by Erik Hjelmvik on Thursday, 30 May 2024 13:05:00 (UTC/GMT)

Tags: #TZSP#NetworkMiner#sniffer

Share: Facebook   Twitter   Reddit   Hacker News Short URL: https://netresec.com/?b=2459ed5


NetworkMiner 2.9 Released

NetworkMiner 2.9

NetworkMiner 2.9 brings several new and improved features to help analysts make sense of network traffic from malware, criminals and industrial control systems. Highlights from this new version include:

  • TZSP support
  • StealC extractor
  • Improved Modbus parser
  • JA4 support
  • GTP decapsulation

Malware Traffic Artifact Extraction

NetworkMiner is a popular tool for extracting artifacts from malware traffic. Such artifacts can be downloaded malware modules, exfiltrated documents and sometimes even screenshots of the infected computer.

Parsers for njRAT and BackConnect (à la IcedID, QakBot and Bazar) traffic was previously added to NetworkMiner. In this release NetworkMiner also gets a parser for StealC, which has quickly become one of the most popular information stealers on Russian-speaking underground forums. The new NetworkMiner 2.9 release extracts screenshots and files that SteakC exfiltrates from the infected machine.

The examples shown below were created by loading a pcap file with StealC traffic from Triage sandbox into NetworkMiner 2.9. NetworkMiner was run in Linux to minimize the risk of accidentally infecting the analysis environment.

Files exfiltrated by StealC

Image: Reassembled system info and documents exfiltrated by StealC to 185.172.128.151

Reassembled screenshot of victim’s desktop sent to StealC C2 server

Image: Reassembled screenshot of victim’s desktop sent to StealC C2 server

NetworkMiner’s VNC and BackConnect VNC parser has also been improved in this release. NetworkMiner’s keylog extraction from VNC now supports lots of keyboard layouts, including Arabic, Cyrillic, Greek, Hebrew, Kana, Korean and Thai. The handling of VNC color profiles has also been improved to convey colors more correctly in screenshots from reassembled VNC and BackConnect VNC traffic. I’d like to thank Brad Duncan and Maxime Thiebaut for their valuable input on this matter!

Another remote management tool that often is misused by hackers and criminals is Remote Manipulator System (RMS) from TektonIT. According to Cyberint’s report Legit remote admin tools turn into threat actors’ tools there are lots of Russian forum posts and even YouTube tutorials showing how to include legitimate RMS components in malware. NetworkMiner now parses RMS’s session setup, which includes information about the client computer as well as the RMS product and version. The screenshot below was created by loading a pcap file from when 3_Рахунок.pdf.exe was executed in JoeSandbox.

Information extracted from RMS traffic

Image: Information extracted from RMS traffic

The country_code number (here 223) also gets converted to a human-readable country (Switzerland) by NetworkMiner, but this country name info is only displayed in the Host Details of the client.

ICS / SCADA

NetworkMiner has supported Modbus/TCP since 2016 (when NetworkMiner 2.0 was released). This Modbus parser has now been updated to display Modbus addresses using the Modicon convention, which explicitly specifies the register type while also signalling to the user that the displayed addresses are one-indexed.

Modbus queries in NetworkMiner

The register types are displayed in parenthesis and should be interpreted as follows:

  • (0)nnnn = Coil
  • (1)nnnn = Discrete input
  • (3)nnnn = Input register
  • (4)nnnn = Holding register

NetworkMiner now also reads Modbus Device Identification messages and displays the reported device info in Host Details. This feature is very handy if you’re building an asset inventory through passive asset discovery (i.e. passively monitoring traffic to identify devices).

Modbus vendor information in NetworkMiner

NetworkMiner 2.9 also supports asset identification for ICS networks that use COTP based protocols, such as Siemens S7 protocol or IEC 61850 MMS, by parsing COTP connection request messages. The identified COTP TSAP names are displayed under Host Details.

NetworkMiner showing a WinCC client and a Siemens SIMATIC device

Image: NetworkMiner showing a WinCC client and a Siemens SIMATIC device

User Interface Improvements

TLS handshake fingerprinting with JA3 was added to NetworkMiner in 2019, but last year John Althouse announced the new JA4+ fingerprint methods. In short JA4+ is a suite of methods designed to fingerprint implementations of a specific set of protocols, including TLS, HTTP and SSH. Most of the fingerprinting methods in the JA4+ suite are patent pending except for the TLS client fingerprinting method JA4, which is an improved version of JA3. NetworkMiner now generates both JA3 and JA4 fingerprints for TLS handshakes. The results from the TLS fingerprinting can be seen in the Parameters tab as well as Host Details. In the example below we’ve loaded TLS traffic to port 8533 on 91.92.251.26 from a Remcos sample on ANY.RUN into NetworkMiner Professional (the free NetworkMiner edition doesn’t parse TLS traffic to non-standard ports).

JA4 hash t13i010400_0f2cb44170f4_5c4c70b73fa0 for Remcos C2 traffic

Image: JA4 hash t13i010400_0f2cb44170f4_5c4c70b73fa0 for Remcos C2 traffic

NetworkMiner has also been improved to extract even more information from HTTP traffic, such as JSON formatted parameters and telemetry data sent to Microsoft by their Device Metadata Retrieval Client (DMRC). We have also improved the DNS extraction, both with regards to DNS TXT labels and Additional Resource Records.

The previous Remcos screenshot displays a latency measurement (0.0935 ms), which is another new feature in this release. This latency value is an estimation of the average timespan from when the host sends a packet until it gets captured by the sniffer. NetworkMiner’s hosts list can be sorted based on the Latency value, whereby local computers and network devices are shown at the top of the list. Another way to achieve similar results is to instead sort the hosts based on “Router Hops Distance”.

NetworkMiner’s user interface has also been improved to make it easier to copy text from the Hosts and Parameters tabs with Ctrl+C or by right-clicking and selecting “Copy …”. The export-to-file function in NetworkMiner Professional now additionally includes data from the Keywords tab.

TZSP Sniffing and Decapsulation

Routers from Mikrotik have a feature called TZSP (short for TaZmen sniffer Protocol), which encapsulates captured traffic into TZSP packets and then transmits them to a streaming server. This feature is similar to PCAP-over-IP and ERSPAN, except TZSP transports the sniffed packets over UDP instead of TCP or GRE.

NetworkMiner now includes a TZSP streaming server, which can receive TZSP encapsulated traffic over a UDP socket. Click “File, Receive TZSP Stream”, select a port (default is 37008) and click “Start” to receive a real-time stream of captured packets from a Mikrotik router. We’ve also added support for TZSP link layer type (DLT_TZSP) pcap files as well as decapsulation of TZSP packets to UDP port 37008. I’d like to thank Jarmo Lahtiranta for proposing this feature!

Speaking of decapsulation – we’ve added a GTP-U parser, which enables NetworkMiner to analyze GPRS traffic from GSM, UMTS, LTE and 5G networks that is transmitted inside a GTP tunnel.

Upgrading to Version 2.9

Users who have purchased NetworkMiner Professional can download version 2.9 from our customer portal, or use the “Check for Updates” feature from NetworkMiner's Help menu. Those who instead prefer to use the free and open source version can grab the latest version of NetworkMiner from the official NetworkMiner page.

Posted by Erik Hjelmvik on Monday, 27 May 2024 09:50:00 (UTC/GMT)

Tags: #NetworkMiner#TZSP#Modbus#JA4#BackConnect#VNC#JSON

Share: Facebook   Twitter   Reddit   Hacker News Short URL: https://netresec.com/?b=245092b


Kubernetes Cryptojacking

In this video I take a look at a cryptojacking attack against a Kubernetes honeypot. The attackers were surprisingly quick to discover this unsecured Kubernetes deployment and use it to mine Monero for them.

The analyzed capture files can be downloaded from
https://share.netresec.com/s/S5ZG2cDKB9AbqwS?path=%2Fk3s-443

This PCAP dataset was created by Noah Spahn, Nils Hanke, Thorsten Holz, Chris Kruegel, and Giovanni Vigna as part of their research for their Container Orchestration Honeypot: Observing Attacks in the Wild paper.

The capture files named "proxy-", such as the analyzed proxy-220404-162837.pcap, were generated by PolarProxy and contain the decrypted Kubernetes API traffic to the master node. This traffic was actually TLS encrypted, but since PolarProxy was used as a TLS interception proxy we can see the Kubernetes API traffic in decrypted form.

IOC List

  • attacker IP: 102.165.16.27 (PIA VPN)
  • kind: DeamonSet
  • name: api-proxy
  • namespace: kube-system
  • image: dorjik/xmrig
  • mining pool: gulf.moneroocean.stream:1012
  • annotation: kubectl.kubernetes.io/last-applied-configuration
  • Monero wallet address: 41pdpXWNMe6NvuDASWXn6ZMdPk4N6amucCHHstNcw2y8caJNdgN4kNeW3QFfc3amCiJ9x6dh8pLboR6minjYZpgk1szkeGg

Posted by Erik Hjelmvik on Tuesday, 07 May 2024 07:50:00 (UTC/GMT)

Tags: #video#CapLoader#PolarProxy

Share: Facebook   Twitter   Reddit   Hacker News Short URL: https://netresec.com/?b=245f018


PolarProxy 1.0 Released

I am thrilled to announce the release of PolarProxy version 1.0 today! Several bugs that affected performance, stability and memory usage have now been resolved in our TLS inspection proxy. PolarProxy has also been updated with better logic for importing external root CA certificates and the HAProxy implementation has been improved. But the most significant addition in the 1.0 release is what we call the “TLS Firewall” mode.

TLS Firewall

PolarProxy now supports rule based logic for determining if a session should be allowed to pass through, get blocked or if the TLS encrypted data should be inspected (i.e. decrypted and re-encrypted) by the proxy. This rule based logic can be used to turn PolarProxy into a TLS firewall. As an example, the ruleset-block-malicious.json ruleset included in the new PolarProxy release blocks traffic to malicious domains in abuse.ch’s ThreatFox IOC database as well as traffic to web tracker domains listed in the EasyPrivacy filter from EasyList. This ruleset also includes an allow list in order to avoid accidentally blocking access to legitimate websites.

PolarProxy TLS Firewall - block malicious, inspect suspicious, bypass legitimate

PolarProxy’s ruleset logic isn’t limited to just domain names. It is also possible to match traffic based on JA3 or JA4 hashes as well as application layer protocol information provided in the ALPN extension of a client’s TLS handshake.

For more information on the ruleset format and how to use PolarProxy as a TLS firewall, see here:
https://www.netresec.com/?page=TlsFirewall

Linux, macOS and Windows builds of the new PolarProxy release can be downloaded from here:
https://www.netresec.com/?page=PolarProxy

Posted by Erik Hjelmvik on Thursday, 02 May 2024 07:00:00 (UTC/GMT)

Tags: #PolarProxy#TLS#inspect#bypass#ThreatFox#ASCII-art

Share: Facebook   Twitter   Reddit   Hacker News Short URL: https://netresec.com/?b=2451e98

Share: Facebook   Twitter   Reddit   Hacker News Short URL: https://netresec.com/?b=2436670

2024 January

Hunting for Cobalt Strike in PCAP

X / twitter

NETRESEC on X / Twitter: @netresec

Mastodon

NETRESEC on Mastodon: @netresec@infosec.exchange